

A TDLAS laser should not be selected by asking for “the wavelength of a gas” as if each molecule had only one usable absorption line.
Gas molecules usually have many transitions across multiple spectral regions. A practical TDLAS wavelength is chosen by balancing absorption strength, interference, concentration range, gas pressure, temperature, available laser tuning range, detector response and system architecture.
For near-infrared DFB-based TDLAS, representative engineering regions include:
- O₂: around 760 nm
- HF: around 1273–1278 nm
- H₂O: around 1368 / 1392 nm
- NH₃: around 1512 / 1531 nm
- C₂H₂: around 1532.7 nm
- CO: around 1567 nm
- CO₂: selected lines in the 1572–1580 nm region for some near-IR systems
- H₂S: around 1578 / 1590 nm
- C₂H₄: around 1620–1627 nm
- CH₄: around 1650.9 / 1653.7 nm
- C₂H₆: around 1684 nm
- HCl: around 1742 nm
These are representative candidate regions, not universal exact laser specifications.
The correct engineering workflow is:
Target Gas → Candidate Absorption Features → Interference Check → Pressure / Temperature → Required Tuning Window → DFB Laser → Package / Fiber → Experimental Validation
That workflow is more reliable than choosing a center wavelength from a table and assuming the laser will automatically cover the correct molecular transition.
How TDLAS Wavelength Selection Actually Works
TDLAS uses a tunable narrow-linewidth laser to scan across a gas absorption feature.
The system measures how much light is absorbed as a function of wavelength and then converts that optical response into gas concentration.
The laser therefore needs to satisfy two requirements at the same time:
- Its emission must reach the target molecular absorption feature.
- Its tuning range must scan the part of the spectrum required by the measurement method.
A practical selection sequence is:
1. Define the Target Gas
Start with the gas you actually need to measure:
- CH₄
- C₂H₆
- NH₃
- CO
- H₂S
- H₂O
- another species
Do not begin with a laser catalog and then try to determine which gas a convenient wavelength might detect.
2. Find Candidate Absorption Features
Use a validated spectroscopy source such as:
- HITRAN
- published measured spectra
- validated internal laboratory spectra
- application-specific spectroscopy literature
HITRAN provides line-by-line data including transition position, intensity and broadening-related parameters.
3. Check Interfering Species
Overlay expected background gases.
For industrial gas sensing, common interferents can include:
- H₂O
- CO₂
- CH₄
- CO
- hydrocarbons
- process-specific gases
A slightly weaker but cleaner absorption feature can be more useful than the strongest line.
4. Define Pressure and Temperature
Pressure changes line width and line shape.
Temperature affects:
- gas density
- transition intensity
- population distribution
- sometimes the effective best measurement condition
The same nominal transition can therefore behave differently in:
- ambient-pressure sensing
- low-pressure cells
- pressurized natural gas
- combustion exhaust
- laboratory spectroscopy
5. Define the Required Laser Tuning Window
The required laser specification is not merely:
1653.7 nm
It is closer to:
a DFB laser whose current- and temperature-tuning range reliably crosses the selected absorption feature over the intended operating conditions.
6. Select Package, Fiber and Detector
After the spectroscopy requirement is clear, define:
- TO or butterfly package
- free-space or fiber output
- TEC / thermistor
- monitor photodiode
- connector
- detector technology
- operating environment
7. Validate with Gas
The final step is experimental validation using:
- target gas
- realistic background gas
- expected pressure
- expected temperature
- intended gas cell
- intended signal-processing method
Representative Near-IR TDLAS Wavelength Regions
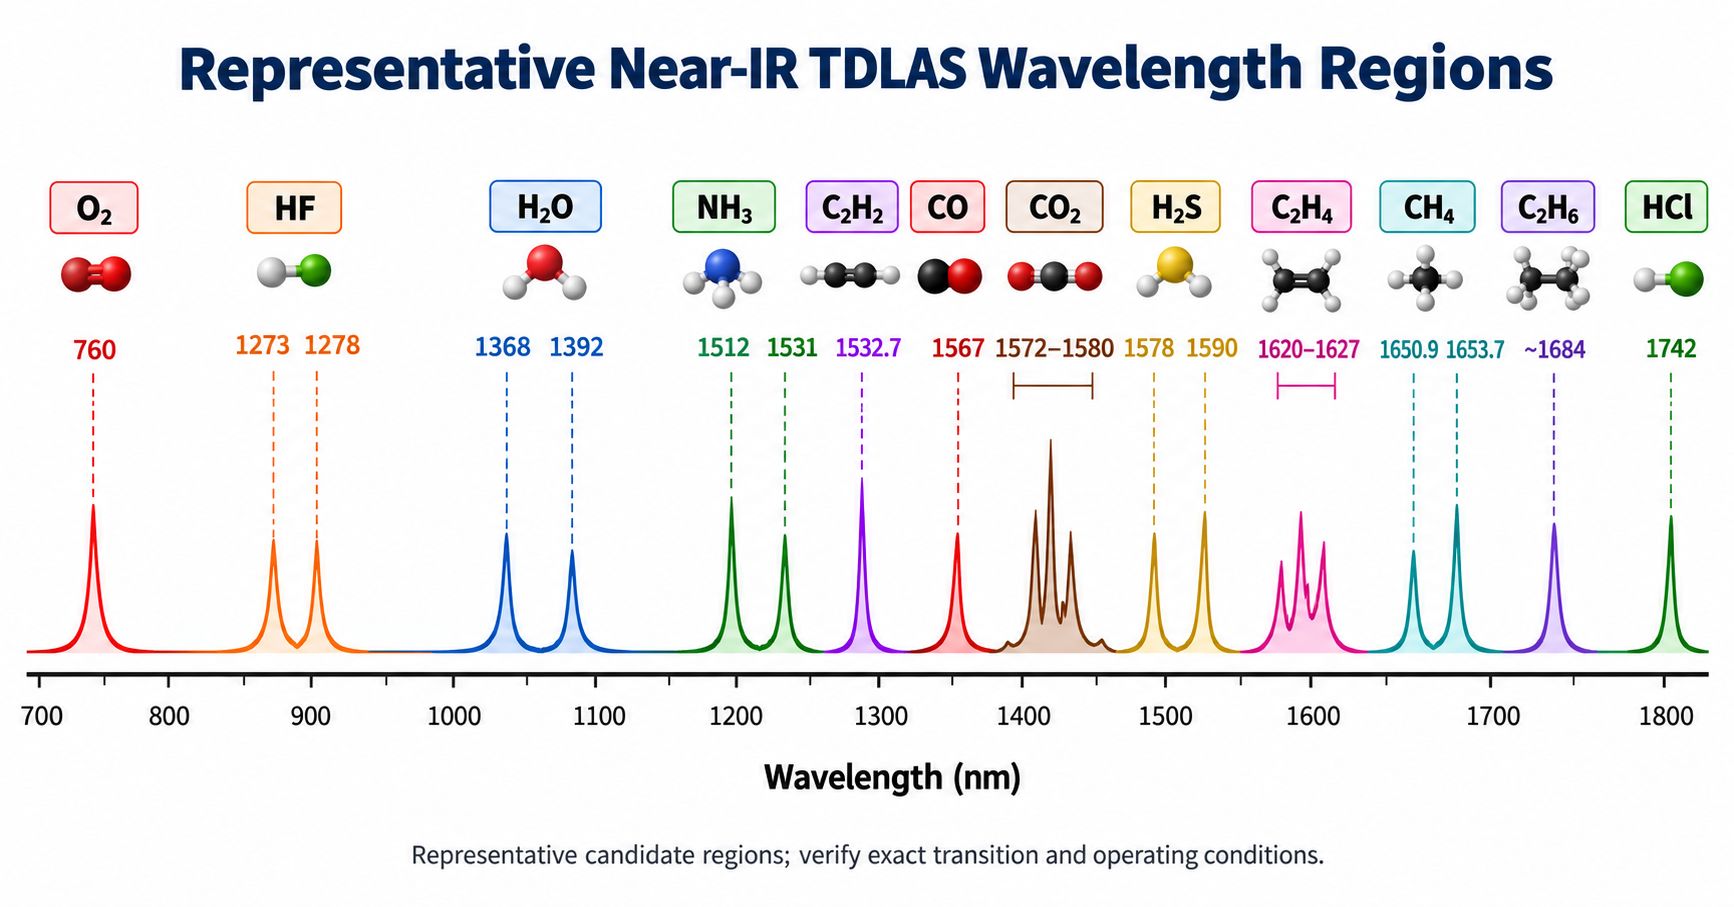
The table below is intended as a starting map, not a substitute for line-by-line spectroscopy.
| Target Gas | Representative Near-IR Region | Engineering Note |
|---|---|---|
| O₂ | ~760 nm | Oxygen A-band region; widely used for oxygen sensing |
| HF | ~1273 / 1278 nm | Candidate region for HF process and safety monitoring |
| H₂O | ~1368 / 1392 nm | Common water-vapor and moisture sensing regions |
| NH₃ | ~1512 / 1531 nm | Used for ammonia sensing and ammonia-slip applications |
| C₂H₂ | ~1532.7 nm | Common near-IR acetylene sensing region |
| CO | ~1567 nm | One near-IR option for CO sensing |
| CO₂ | ~1572–1580 nm region | Candidate near-IR transitions; application-specific selection required |
| H₂S | ~1578 / 1590 nm | Candidate near-IR regions for hydrogen sulfide |
| C₂H₄ | ~1620–1627 nm | Ethylene sensing region |
| CH₄ | ~1650.9 / 1653.7 nm | Common methane TDLAS regions |
| C₂H₆ | ~1684 nm | Ethane sensing and natural-gas speciation |
| HCl | ~1742 nm | Hydrogen chloride sensing region |
Lumi’s current gas-sensing pigtailed TO platform already supports several of these wavelength directions, including 1273, 1392, 1512, 1531 and 1653 nm, and its product documentation explicitly notes that a gas usually has multiple absorption peaks and that the client should select the best center wavelength for the actual system.
See the Cooled TO-CAN Laser Diode with Fiber Pigtail for Gas Detection.
Representative candidate regions must always be verified against the exact transition, gas matrix, pressure, temperature and required laser tuning range.
Why One Gas Can Have Several Useful Wavelengths
Methane is a good example.
You may encounter near-IR methane wavelengths such as:
- 1647 nm
- 1650.9 nm
- 1653.7 nm
- 1660 nm
This does not mean one of these is universally correct and the others are wrong.
Different transitions may offer different combinations of:
- absorption strength
- interference
- line isolation
- available DFB technology
- tuning behavior
- detector compatibility
- intended concentration range
The same logic applies to:
- H₂O at 1368 / 1392 nm
- NH₃ at 1512 / 1531 nm
- H₂S at 1578 / 1590 nm
- C₂H₄ at 1620 / 1627 nm
The wavelength-selection problem is therefore a spectroscopy problem first and a laser purchasing problem second.
Choosing a TDLAS Line Is More Than Finding the Strongest Peak
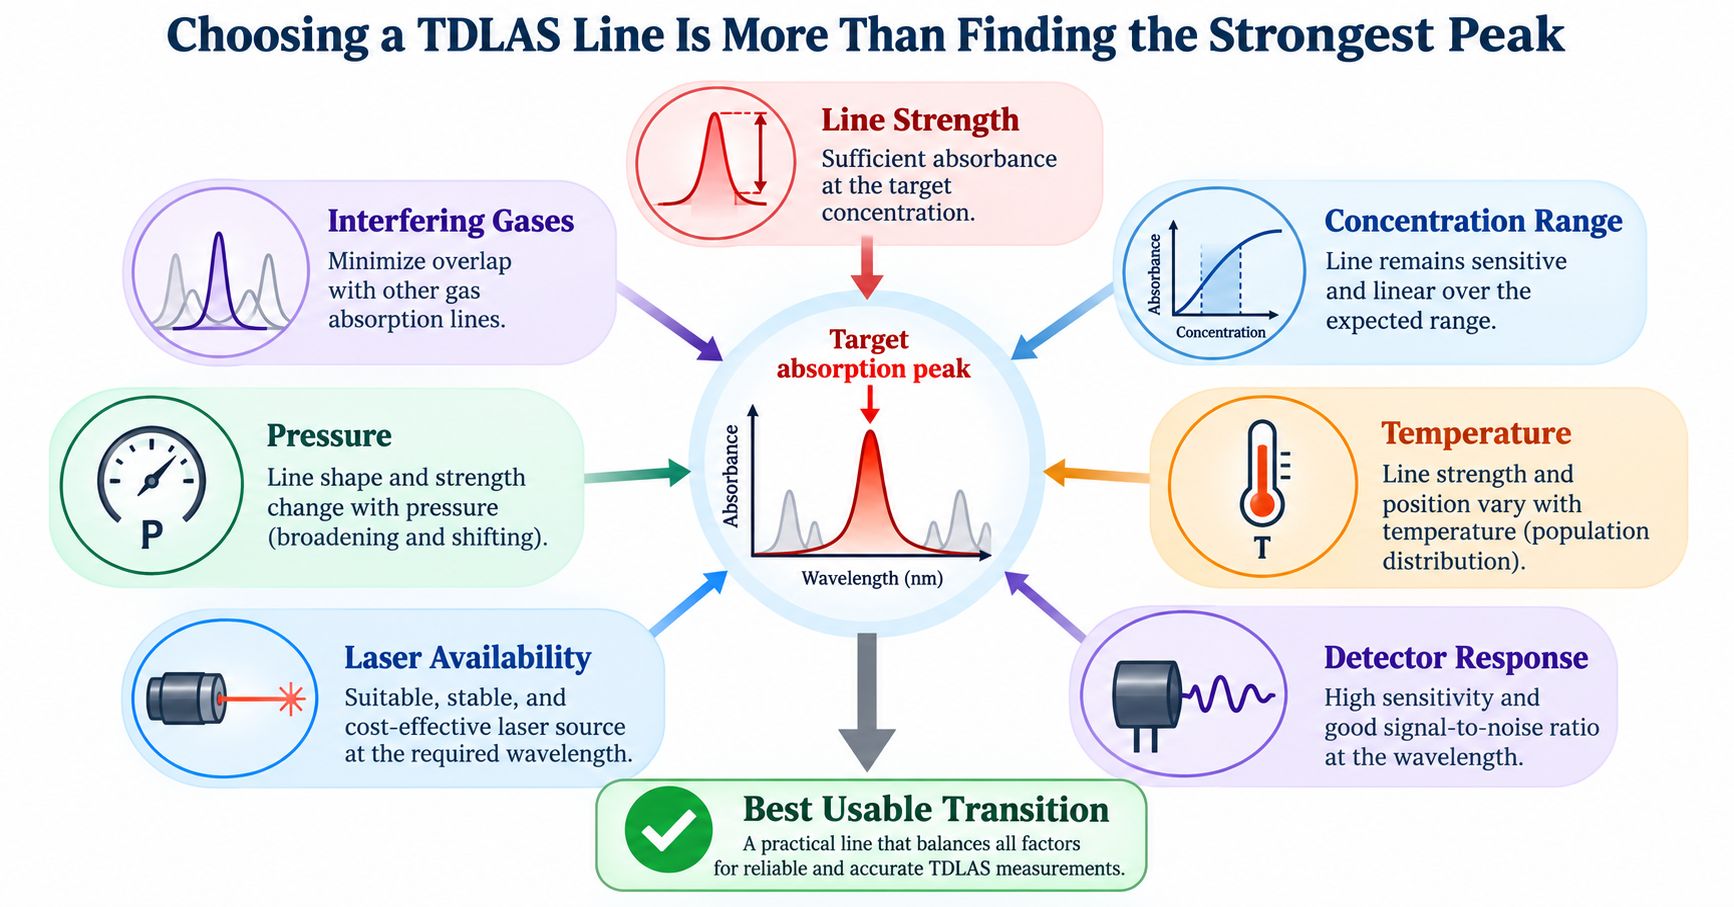
The strongest available absorption feature is not always the best practical measurement line.
Line Strength
The selected line must provide enough absorbance at the target concentration and optical path length.
A very weak line may require:
- longer path length
- higher optical power
- stronger signal processing
But an extremely strong feature can also be inconvenient in high-concentration measurements.
Interfering Gases
A strong target line may overlap with:
- H₂O
- CO₂
- CH₄
- another process gas
A somewhat weaker but cleaner line may provide more robust measurement.
Concentration Range
A low-ppm sensor and a percent-level process analyzer may prefer different transitions.
The selected line should remain useful over the intended concentration range.
Pressure
Pressure changes the spectral line width.
At elevated pressure, nearby features can merge more strongly and create additional interference.
Temperature
Temperature influences line intensity and gas density.
High-temperature process measurements can therefore require different modeling from room-temperature gas cells.
Laser Availability
The ideal spectroscopic transition is only useful if a laser can reach it with the required:
- tuning span
- output power
- linewidth
- SMSR
- stability
- package
Detector Response
The detector must provide adequate responsivity and noise performance at the selected wavelength.
The practical target is therefore:
the best usable transition, not simply the strongest theoretical peak.
From HITRAN Spectrum to a DFB Laser Specification
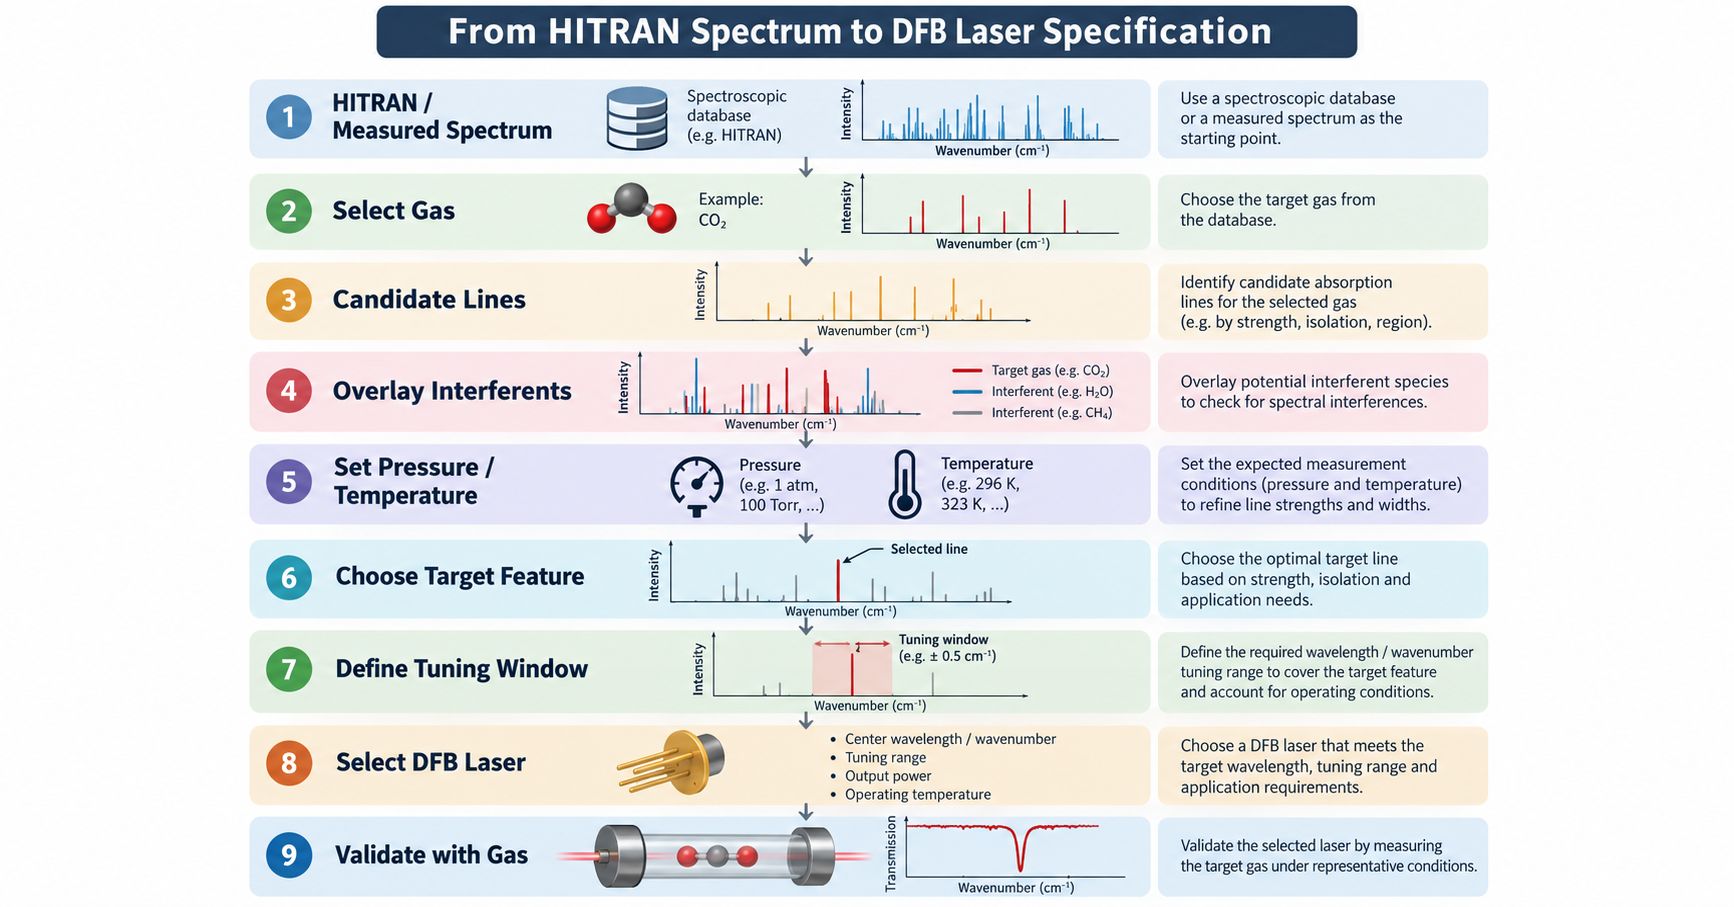
HITRAN is one of the most important starting points for TDLAS design.
It provides spectroscopic transition data such as:
- line position
- line intensity
- isotopologue information
- lower-state energy
- pressure broadening
- pressure shift
HITRAN line positions are provided in vacuum wavenumber, cm⁻¹, and reference line intensities are defined at 296 K.
HITRAN’s HAPI tools can also be used to download, filter and process line-by-line data and calculate spectra under different conditions.
A practical workflow is:
Step 1 — Select the Gas
Filter the database for the target molecule and isotopologue.
Step 2 — Identify Candidate Lines
Look for transitions inside a region where suitable diode lasers and detectors exist.
Step 3 — Overlay Interfering Gases
Add spectra for expected background species.
Step 4 — Set Pressure and Temperature
Model the expected operating conditions rather than relying only on the reference database state.
Step 5 — Choose the Target Feature
Balance:
- line strength
- isolation
- interference
- concentration range
- laser availability
Step 6 — Define the Laser Tuning Window
Convert the spectroscopy requirement into:
- minimum wavelength
- maximum wavelength
- current-tuning requirement
- temperature-tuning requirement
Step 7 — Select the DFB Laser
Now evaluate real laser products and custom wavelength options.
Step 8 — Validate with the Gas Cell
Confirm that the selected laser crosses the intended feature under real operating conditions.
For authoritative spectroscopy data, see HITRANonline and HITRAN HAPI.
HITRAN Is a Starting Point, Not the Final Laser Specification
A common mistake is to open a simulated spectrum, find the strongest peak and immediately order a laser at that rounded wavelength.
That skips several engineering steps.
HITRAN is a molecular spectroscopy database. It does not know:
- your gas concentration
- your detector noise
- your gas-cell path length
- your package limitations
- your fiber loss
- your driver capability
- your exact background gas mixture
Even an apparently ideal absorption feature can become unsuitable if:
- another gas overlaps it
- pressure broadening merges nearby structures
- the required tuning range falls outside the laser’s usable window
- the detector is weak at that wavelength
- the target concentration causes excessive or insufficient absorption
This is why the spectroscopy requirement should be converted into an actual laser tuning specification before purchasing.
Wavenumber vs Wavelength
Spectroscopy databases often use wavenumber in cm⁻¹, while laser suppliers usually quote wavelength in nm.
The approximate conversion is:
Wavelength (nm) ≈ 10,000,000 / Wavenumber (cm⁻¹)
or:
Wavelength (µm) ≈ 10,000 / Wavenumber (cm⁻¹)
For example, an absorption feature around:
5937 cm⁻¹
corresponds to approximately:
1.684 µm
or:
1684 nm
For high-precision line selection, use the original spectroscopy data rather than relying on rounded manual conversions.
Methane — CH₄
Representative Near-IR Regions
Common methane TDLAS directions include:
- 1650.9 nm
- 1653.7 nm
Other near-IR methane lines also exist.
Why 1653.7 nm Is Popular
The 1653.7 nm region combines:
- useful CH₄ absorption
- mature DFB laser technology
- InGaAs detector compatibility
- fiber-compatible components
- direct current tuning
- temperature control
Lumi currently offers a Cooled 1653.7nm DFB Laser Diode for Methane Gas Sensing.
Published parameters include:
- 1653.7 nm typical center wavelength
- 6 mW typical output power
- 35 dB typical SMSR
- integrated TEC
- 0.1 nm/°C typical temperature coefficient
- 0.02 nm/mA typical current coefficient
These tuning coefficients apply to that specific product and should not be reused for other wavelengths without checking the corresponding datasheet.
For a methane-specific selection discussion, see 1650nm vs 1653nm Methane Laser Diode.
Ethane — C₂H₆
Representative Region
~1684 nm
Ethane has useful near-infrared absorption in the 1.68 µm region.
But 1684 nm should be treated as a nominal engineering region rather than one universal exact line.
The selected DFB needs to cover the actual C₂H₆ absorption feature used by the analyzer.
Methane has nearby spectral structure, so CH₄ interference should also be considered.
For the detailed discussion, see 1684 nm Ethane DFB Laser Diode for TDLAS.
Water Vapor — H₂O
Representative Regions
- ~1368 nm
- ~1392 nm
These regions are commonly used in near-IR moisture and water-vapor sensing.
Water measurement presents a special challenge because water may be present not only in the target gas but also in:
- ambient air
- tubing
- cell surfaces
- sampling components
Adsorption and desorption can therefore influence response time and background stability.
Lumi’s current gas-sensing DFB platform includes a 1392 nm direction for wavelength-specific TDLAS projects.
Ammonia — NH₃
Representative Regions
- ~1512 nm
- ~1531 nm
Near-IR ammonia sensing is used in applications including:
- ammonia slip
- chemical processing
- environmental monitoring
- agricultural gas analysis
The best transition depends strongly on:
- water background
- expected NH₃ level
- sample pressure
- temperature
- required sensitivity
Lumi’s pigtailed TO gas-sensing family currently includes 1512 and 1531 nm wavelength options.
Acetylene — C₂H₂
Representative Region
~1532.7 nm
Acetylene near this wavelength is used in:
- process gas sensing
- dissolved gas analysis concepts
- calibration and wavelength-reference applications
The actual target line still needs to be matched to the intended pressure and concentration range.
Carbon Monoxide — CO
Representative Near-IR Region
~1567 nm
This is one practical near-infrared CO sensing option.
However:
1567 nm is not “the CO wavelength.”
CO also has stronger absorption at longer wavelengths, including around the 2.3 µm region.
The near-IR option can be attractive when the project prioritizes:
- telecom-derived DFB technology
- compact packaging
- InGaAs detection
- fiber integration
The longer-wavelength option may be more attractive when stronger molecular absorption is the priority.
Carbon Dioxide — CO₂
CO₂ has several useful absorption regions.
Near-IR project directions can include wavelengths around the 1572–1580 nm region, while stronger bands are available at longer wavelengths.
Lumi’s current DFB portfolio includes a 1572 nm-region DFB direction for CO / CO₂ projects where the selected absorption transition falls inside the available tuning range.
The key phrase is:
where the selected transition falls inside the available tuning range.
Do not treat “1572 nm” as a universal CO₂ specification.
Hydrogen Sulfide — H₂S
Representative Near-IR Regions
- ~1578 nm
- ~1590 nm
H₂S sensing is relevant to:
- sour gas
- petrochemical systems
- gas processing
- safety monitoring
Because H₂S can be measured in gas mixtures containing CH₄, CO₂ and H₂O, line selection should include interference analysis.
A laser labeled “1590 nm” is not enough information by itself.
The engineer should define:
- exact target line
- required scan range
- pressure
- temperature
- background gas composition
Ethylene — C₂H₄
Representative Region
~1620–1627 nm
Ethylene can be measured in selected industrial and research applications.
Candidate lines around 1620, 1625 and 1627 nm are commonly listed in near-IR DFB gas-sensing portfolios.
Again, the final choice depends on the system conditions rather than the nominal gas-to-wavelength map alone.
Hydrogen Fluoride — HF
Representative Region
~1273–1278 nm
Near-IR HF sensing can be relevant to:
- semiconductor processing
- chemical production
- aluminum processing
- selected battery and safety applications
Lumi’s current gas-sensing platform includes a 1273 nm direction.
Oxygen — O₂
Representative Region
~760 nm
The oxygen A-band near 760 nm is widely used for TDLAS oxygen measurement.
This wavelength range differs from Lumi’s core 1.2–1.7 µm DFB portfolio, but it is important in any general TDLAS wavelength map.
Detector choice at 760 nm can differ from the InGaAs-based systems common around 1.3–1.7 µm.
Hydrogen Chloride — HCl
Representative Region
~1742 nm
HCl near this wavelength is used in process and emissions sensing.
The detector and fiber ecosystem at 1.74 µm should be checked carefully because component availability can differ from the conventional telecom bands.
Near-IR vs Mid-IR TDLAS
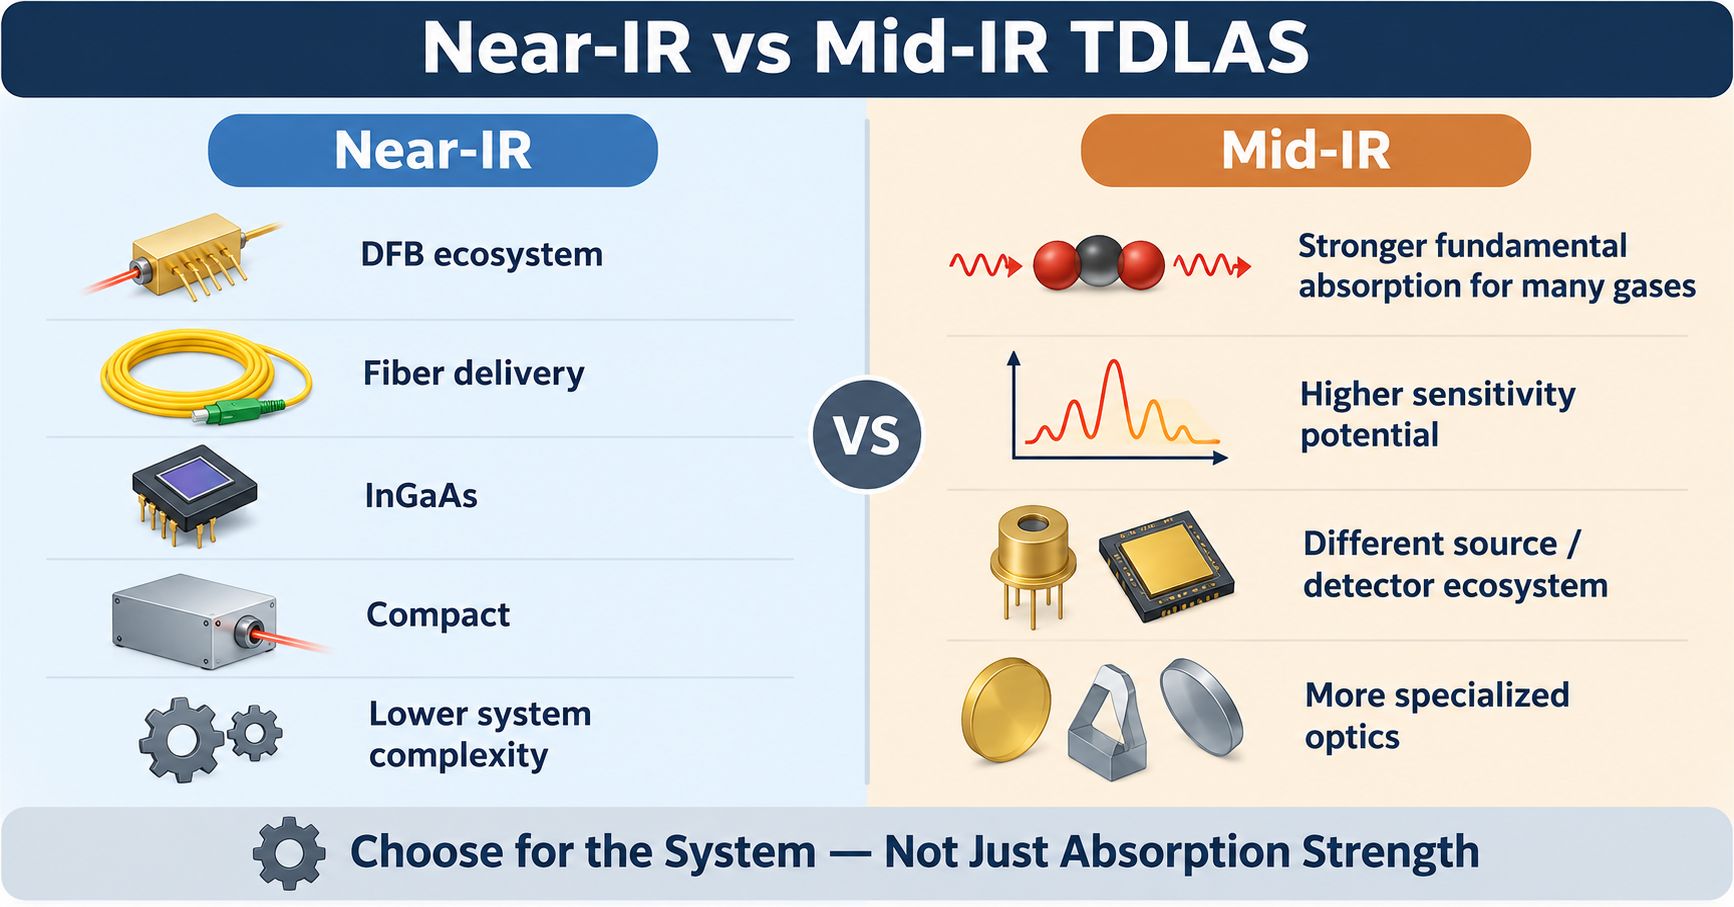
Near-infrared TDLAS is attractive because the laser and detector ecosystem is mature.
Mid-infrared spectroscopy is attractive because many gases have stronger fundamental molecular absorption there.
Neither region is automatically better.
| Near-IR | Mid-IR |
|---|---|
| Mature DFB diode ecosystem | Stronger fundamental absorption for many gases |
| SM fiber delivery widely available | Higher sensitivity potential |
| InGaAs detectors common | Different detector technologies often required |
| Compact source packages | More specialized optics can be required |
| Direct current modulation | Source architectures can differ |
| Lower system complexity in many OEM designs | Can offer stronger spectroscopic signal |
Near-IR is often chosen because it simplifies the complete instrument.
Mid-IR may be chosen when absorption strength and sensitivity justify the additional optical and source complexity.
Choose the spectral region for the complete system, not only for the strongest molecular absorption.
Why DFB Lasers Are Common in TDLAS
DFB architecture is widely used because TDLAS requires a wavelength-selective, tunable source.
A DFB laser can provide:
- dominant single longitudinal mode
- high SMSR
- narrow spectral output
- direct current tuning
- temperature tuning
- compact semiconductor packaging
- fiber-coupled options
The laser can be temperature-positioned near the target absorption region and then current-scanned across the feature.
For the architecture comparison, see DFB vs FP vs VCSEL: Laser Diode Types Compared.
Nominal Center Wavelength vs Usable Tuning Range
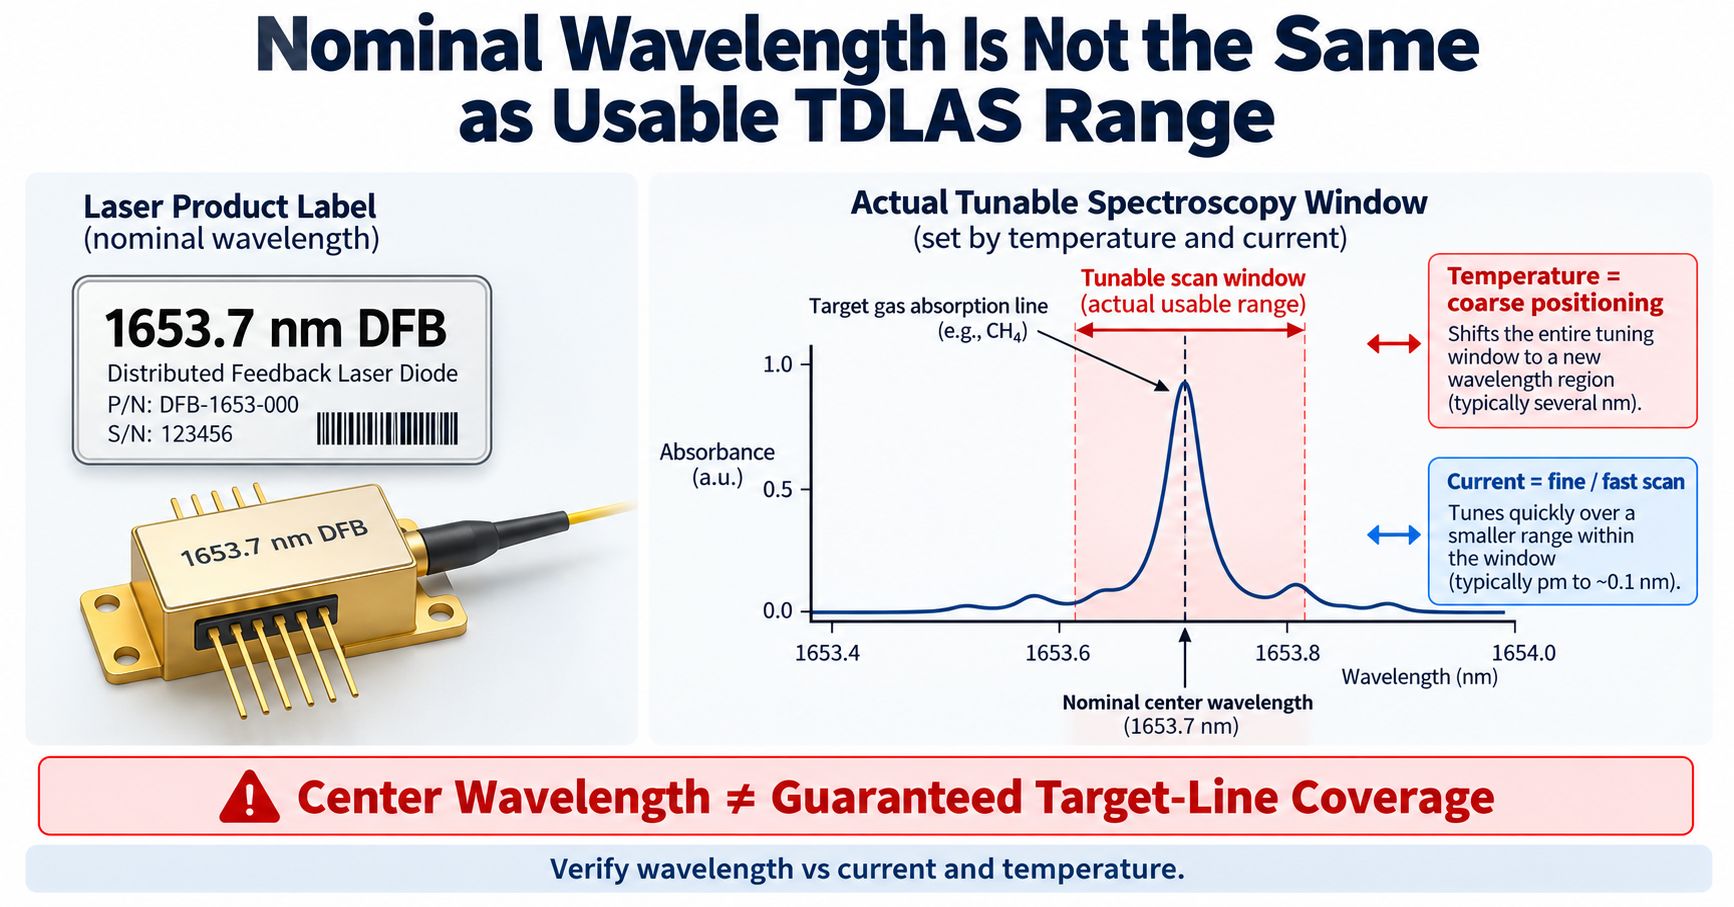
This is one of the most important concepts in TDLAS purchasing.
Suppose a product is labeled:
1653.7 nm DFB
That does not automatically tell you:
- the wavelength at every temperature
- the wavelength at every current
- the scan width
- the exact mode-hop-free range
- whether the target CH₄ line is reached under your operating conditions
Temperature Tuning
Temperature is commonly used for relatively slow, coarse positioning of the laser wavelength.
Changing temperature modifies the semiconductor refractive index and effective grating condition.
Current Tuning
Injection current can provide faster wavelength scanning around the operating point.
Current modulation can also be used for:
- DAS scans
- WMS modulation
- 1f / 2f detection
Why the Tuning Window Matters
The actual requirement is not:
center wavelength = target line
The requirement is:
the usable wavelength-vs-current-and-temperature range must cross the target line with sufficient margin.
Center wavelength does not guarantee target-line coverage.
For Lumi’s current DFB portfolio, tuning coefficients differ by model. The 1653.7 nm product, 1650.9 nm methane product and 1572 nm DFB each have their own published tuning characteristics.
Linewidth and SMSR
Two additional laser parameters frequently appear in TDLAS RFQs.
Linewidth
The laser spectrum should be sufficiently narrow for the selected spectroscopy method and absorption feature.
A narrower source can improve spectral discrimination, but the required linewidth depends on:
- gas pressure
- line width
- modulation method
- detector bandwidth
- system resolution
SMSR
Side-mode suppression ratio indicates how strongly the dominant longitudinal mode exceeds side modes.
A strong SMSR is valuable because unwanted longitudinal modes can probe different parts of the gas spectrum.
However, higher SMSR alone does not guarantee a better analyzer.
The full source behavior matters.
Optical Power: More Is Not Always Better
More optical power can improve received detector signal.
But TDLAS power selection should consider:
- detector saturation
- path length
- gas concentration
- optical loss
- fiber coupling
- cell windows
- multipass optics
- etalon effects
- required signal-to-noise ratio
For fiber-coupled lasers, always clarify whether power is specified:
- at the chip
- at the package window
- at the fiber end
- after the connector
For an OEM analyzer, the most relevant value is usually the optical power delivered to the measurement path.
Detector Selection
The detector must match the chosen wavelength.
For many TDLAS systems in the 1.2–1.7 µm region, InGaAs photodetectors are a common choice.
At shorter wavelengths such as the 760 nm oxygen region, silicon-based detection may be suitable.
At longer wavelengths, detector options may include:
- extended InGaAs
- InAs
- InSb
- MCT
- other specialized detectors
Detector responsivity and noise should be included in the wavelength-selection decision.
Free-Space vs Fiber-Coupled TDLAS
Free-space and fiber output are both valid.
Free-Space
Useful when:
- laser and gas cell are close together
- the OEM controls optical alignment
- the optical bench is compact
- source-to-fiber loss should be avoided
Fiber-Coupled
Useful when:
- the laser is remote from the cell
- the analyzer is modular
- stable fiber delivery is valuable
- a fiber collimator feeds the gas cell
- the source needs to be isolated from the optical head
Lumi currently offers both butterfly and pigtailed TO gas-sensing configurations.
For a detailed comparison, see What Is a Fiber-Coupled Laser Diode?.
TO-Can vs Butterfly for TDLAS
Package choice is the next step after wavelength and tuning requirements are defined.
TO-Can
Advantages:
- compact
- mature package
- lower mechanical footprint
- free-space or pigtailed options
- TEC available in selected designs
Butterfly
Advantages:
- more internal integration space
- TEC
- thermistor
- monitor photodiode
- fiber pigtail
- optical isolator options
- multiple electrical pins
A butterfly package can simplify a high-stability fiber-fed analyzer, while a TO package can be ideal for a compact OEM module.
For a deeper comparison, see Butterfly vs TO-CAN Package for Gas Sensing Laser Diodes.
A Complete TDLAS Laser Selection Workflow
A practical engineering sequence is:
1. Target Gas
What molecule must be measured?
2. Candidate Spectrum
Which spectral bands are accessible?
3. Spectroscopy Data
Use HITRAN and validated measured spectra.
4. Interference Analysis
What other gases will be present?
5. Pressure / Temperature / Concentration
Define the real sample conditions.
6. Target Transition
Choose the best usable absorption feature.
7. Required Tuning Window
Define the minimum and maximum wavelength the laser must reach.
8. DFB Selection
Check:
- tuning
- SMSR
- linewidth
- power
- mode behavior
- operating temperature
9. Package and Optical Interface
Choose:
- TO
- butterfly
- free-space
- SM fiber
- connector
- TEC / thermistor / MPD
10. Gas Validation
Validate the complete source in the actual gas system.
This is the workflow that converts molecular spectroscopy into a purchaseable laser specification.
TDLAS DFB Laser RFQ Checklist
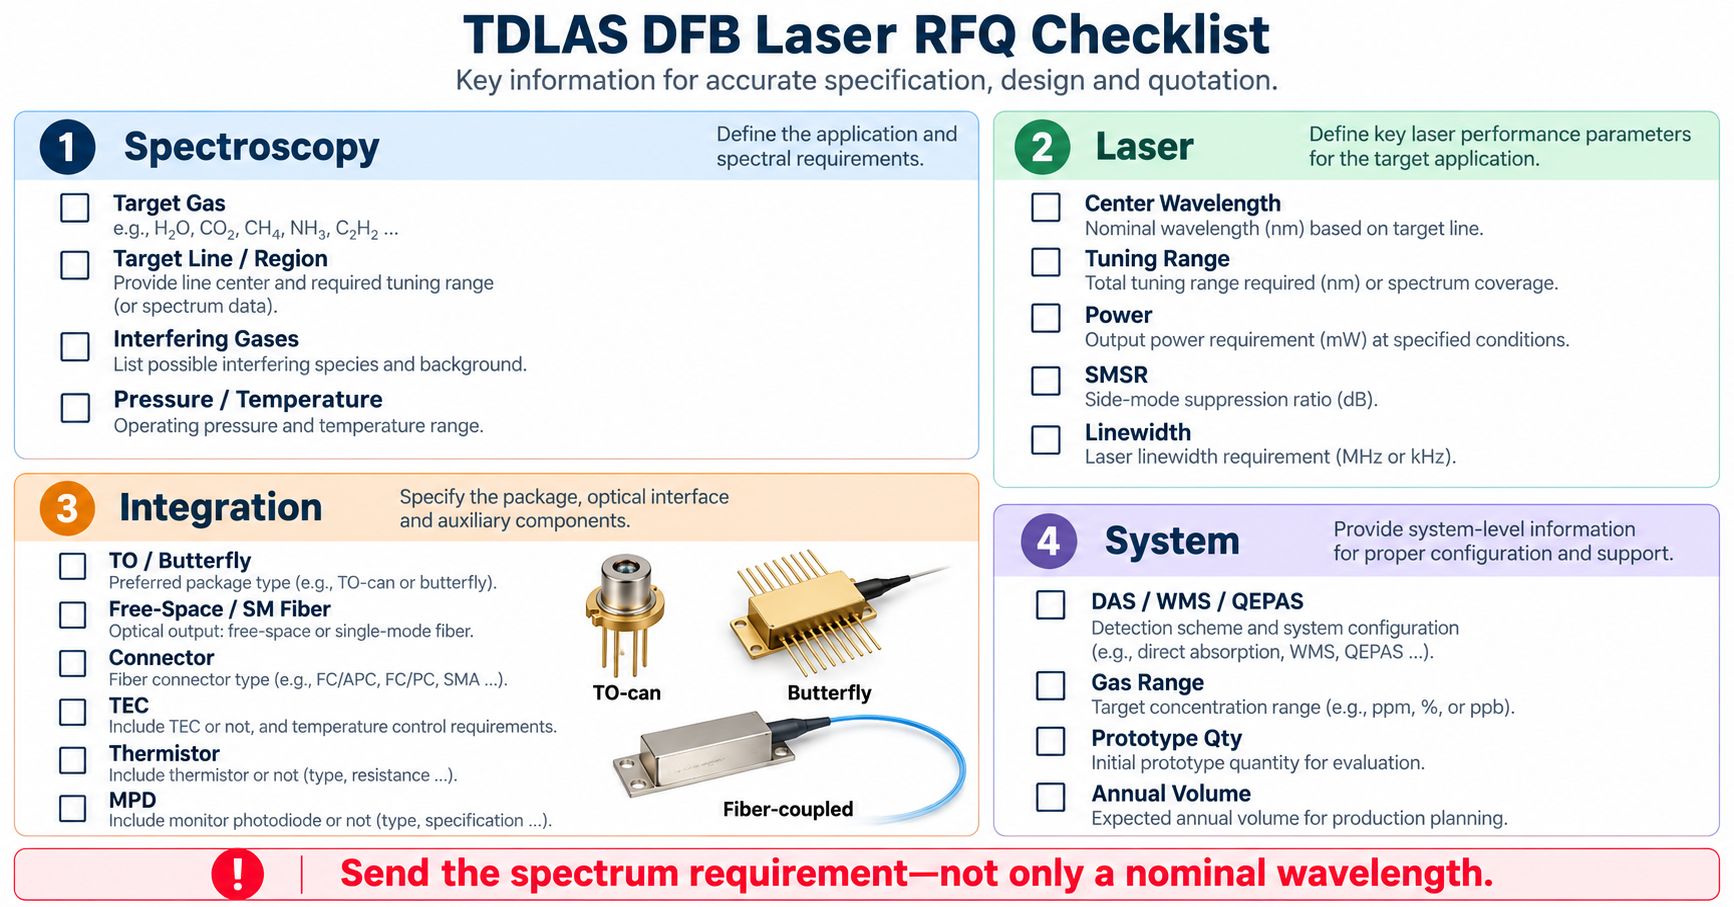
A useful RFQ should include four groups of information.
Spectroscopy
- Target gas
- Target line / spectral region
- Interfering gases
- Sample pressure
- Sample temperature
Laser
- Nominal center wavelength
- Required tuning range
- Optical power
- SMSR
- Linewidth
- current modulation requirement
- temperature tuning requirement
Integration
- TO or butterfly
- free-space or SM fiber
- connector
- TEC
- thermistor
- monitor photodiode
- package size constraints
System
- DAS / WMS / QEPAS
- gas concentration range
- optical path length
- detector type
- prototype quantity
- annual volume
A good first sentence to a laser supplier is:
We are developing a TDLAS analyzer for [gas] and need a DFB source whose verified tuning range covers [target line / spectral region] under our operating pressure and temperature.
That is far more useful than:
We need a 1653 nm laser.
Representative Lumi TDLAS Platforms
Lumi’s current DFB portfolio covers several gas-sensing architectures.
1653.7 nm Methane DFB
The 1653.7nm Cooled DFB Laser Diode is a TEC-controlled methane-oriented TO source.
1650.9 nm Methane DFB
Lumi also provides a heating-controlled 1650.9 nm methane DFB direction for systems using a different CH₄ transition strategy.
1572 nm DFB for CO / CO₂-Related Projects
The Lumi DFB Laser Diode portfolio includes a 1572 nm-region direction where the selected CO / CO₂ absorption transition matches the available tuning range.
1273–1653 nm Gas-Sensing Pigtailed TO
The Cooled TO-CAN Laser Diode with Fiber Pigtail for Gas Detection supports wavelength directions including:
- 1273 nm
- 1392 nm
- 1512 nm
- 1531 nm
- 1653 nm
with:
- TEC
- thermistor
- SM / MM fiber ordering options
- multiple connector options
Fiber-Coupled Butterfly DFB
Lumi also provides fiber-pigtailed butterfly DFB platforms for wavelength-specific gas sensing and TDLAS integration.
See the Fiber-Coupled Laser Diode range.
~1684 nm Ethane Projects
Ethane around 1684 nm should be treated as a project-specific wavelength requirement.
The selected source should be evaluated against:
- the actual C₂H₆ absorption feature
- methane interference
- required tuning range
- package
- fiber interface
- thermal-control strategy
See 1684 nm Ethane DFB Laser Diode for TDLAS.
Common TDLAS Wavelength-Selection Mistakes
Mistake 1: Assuming a Gas Has Only One Absorption Wavelength
Most molecules have many transitions.
The wavelength table is a starting point, not a final specification.
Mistake 2: Buying a Laser from the Nominal Wavelength Alone
A center wavelength does not guarantee that the laser can scan the desired absorption feature.
Mistake 3: Selecting the Strongest Peak Without Checking Interference
A weaker but cleaner line may provide better real-world measurement.
Mistake 4: Ignoring Pressure
Pressure broadening can alter line shape and overlap.
Mistake 5: Ignoring Temperature
Line strength, gas density and spectral behavior depend on temperature.
Mistake 6: Reusing Tuning Coefficients from Another DFB Product
Each laser design has its own current and temperature tuning characteristics.
Mistake 7: Treating HITRAN as an Analyzer Performance Specification
HITRAN provides spectroscopy data.
It does not guarantee:
- detection limit
- accuracy
- response time
- calibration stability
Those are complete-system results.
Frequently Asked Questions
What wavelength laser is used for methane TDLAS?
1650.9 nm and 1653.7 nm are common near-infrared methane regions. The final wavelength should match the selected CH₄ transition and required tuning range.
What wavelength is used for ethane detection?
A commonly used near-infrared ethane region is around 1684 nm. The exact target feature must be validated because ethane absorption in this region is structured and methane can interfere nearby.
What wavelength is used for ammonia TDLAS?
1512 nm and 1531 nm are common near-infrared NH₃ directions. The best line depends on pressure, temperature, water background and required concentration range.
What wavelength is used for H₂S detection?
Near-infrared H₂S systems may use regions around 1578 or 1590 nm. The exact transition and interference environment should be checked before choosing the DFB source.
What wavelength is used for carbon monoxide?
Around 1567 nm is one near-infrared option. CO also has stronger absorption at longer wavelengths, including around the 2.3 µm region.
What wavelength is used for water vapor TDLAS?
1368 nm and 1392 nm are common near-infrared H₂O regions.
Is HITRAN enough to select a DFB laser?
No. HITRAN is an essential spectroscopy source, but laser selection must also consider interference, pressure, temperature, tuning range, detector response, package and the complete optical system.
What is more important: center wavelength or tuning range?
For spectroscopy, the usable tuning range is often more important than the nominal center-wavelength label because the laser must actually cross the selected absorption feature.
Why does temperature change a DFB laser wavelength?
Temperature changes the semiconductor refractive index and effective grating condition, shifting the DFB emission wavelength.
Why does injection current tune the wavelength?
Current changes carrier density and junction temperature, producing a relatively fast wavelength shift that can be used for scanning and modulation.
Start with the Gas Spectrum, Then Choose the Laser
The most reliable TDLAS development sequence is:
Target Gas → Spectrum → Interference → Pressure / Temperature → Target Transition → Tuning Window → DFB Laser → Package / Fiber → Validation
A wavelength table is useful for discovering candidate regions.
It is not the final laser specification.
For an OEM TDLAS project, send Lumi:
- target gas
- selected absorption region
- required tuning span
- expected interferents
- pressure
- temperature
- concentration range
- optical output
- package
- detection method
- expected volume
Lumi can then evaluate the wavelength, package and fiber configuration against the spectroscopy requirement rather than only a rounded nominal wavelength.
