

Mud gas logging turns gases released while drilling into a depth-related record of hydrocarbon composition. Methane (CH₄, commonly called C1 in mud logging) is usually the dominant light hydrocarbon, while ethane (C₂H₆, C2) adds valuable compositional information that can support hydrocarbon-show interpretation, fluid typing and comparison between formation intervals.
A laser-based analyzer can approach these two gases with dedicated narrow-linewidth DFB channels:
- 1653.7 nm DFB → methane (CH₄)
- ~1684 nm DFB → ethane (C₂H₆)
The attraction of this architecture is speed and selectivity. Instead of chromatographically separating a broad C1–C5 mixture before every measurement, dedicated laser channels can continuously interrogate selected molecular absorption regions and provide rapid CH₄ and C₂H₆ concentration signals for correlation with drilling depth.
However, the optical measurement is only one part of the mud-gas workflow.
A precise DFB laser cannot correct an unrepresentative mud-gas sample, and a CH₄/C₂H₆ ratio should be treated as an interpretation aid rather than a universal oil-versus-gas rule.
Gas extraction efficiency, mud type, lag time, gas-trap design, sample conditioning, pressure, temperature and contamination can all affect the gas reaching the analyzer. For that reason, methane and ethane laser measurements should be integrated with the broader mud-logging context rather than interpreted in isolation.
Traditional mud logging commonly uses flame ionization detection for total hydrocarbons and gas chromatography to resolve methane, ethane, propane, butanes and pentanes. Laser spectroscopy can complement that established workflow or form part of a specialized real-time analyzer when fast targeted CH₄/C₂H₆ measurement is valuable.
What Is Mud Gas Logging?
Mud gas logging analyzes gases carried to the surface by the circulating drilling fluid.
As the drill bit penetrates porous or fractured formations, fluids and gases from the rock can enter the drilling mud. The mud then returns to surface through the annulus.
At the surface, a gas trap or extractor separates gas from the returning mud. The extracted gas is conditioned and transported to the mud-logging unit for measurement.
A simplified workflow is:
Formation → Drill Bit → Gas Enters Mud → Mud Returns to Surface → Gas Trap → Sample Conditioning → Gas Analyzer → Gas Log vs Depth
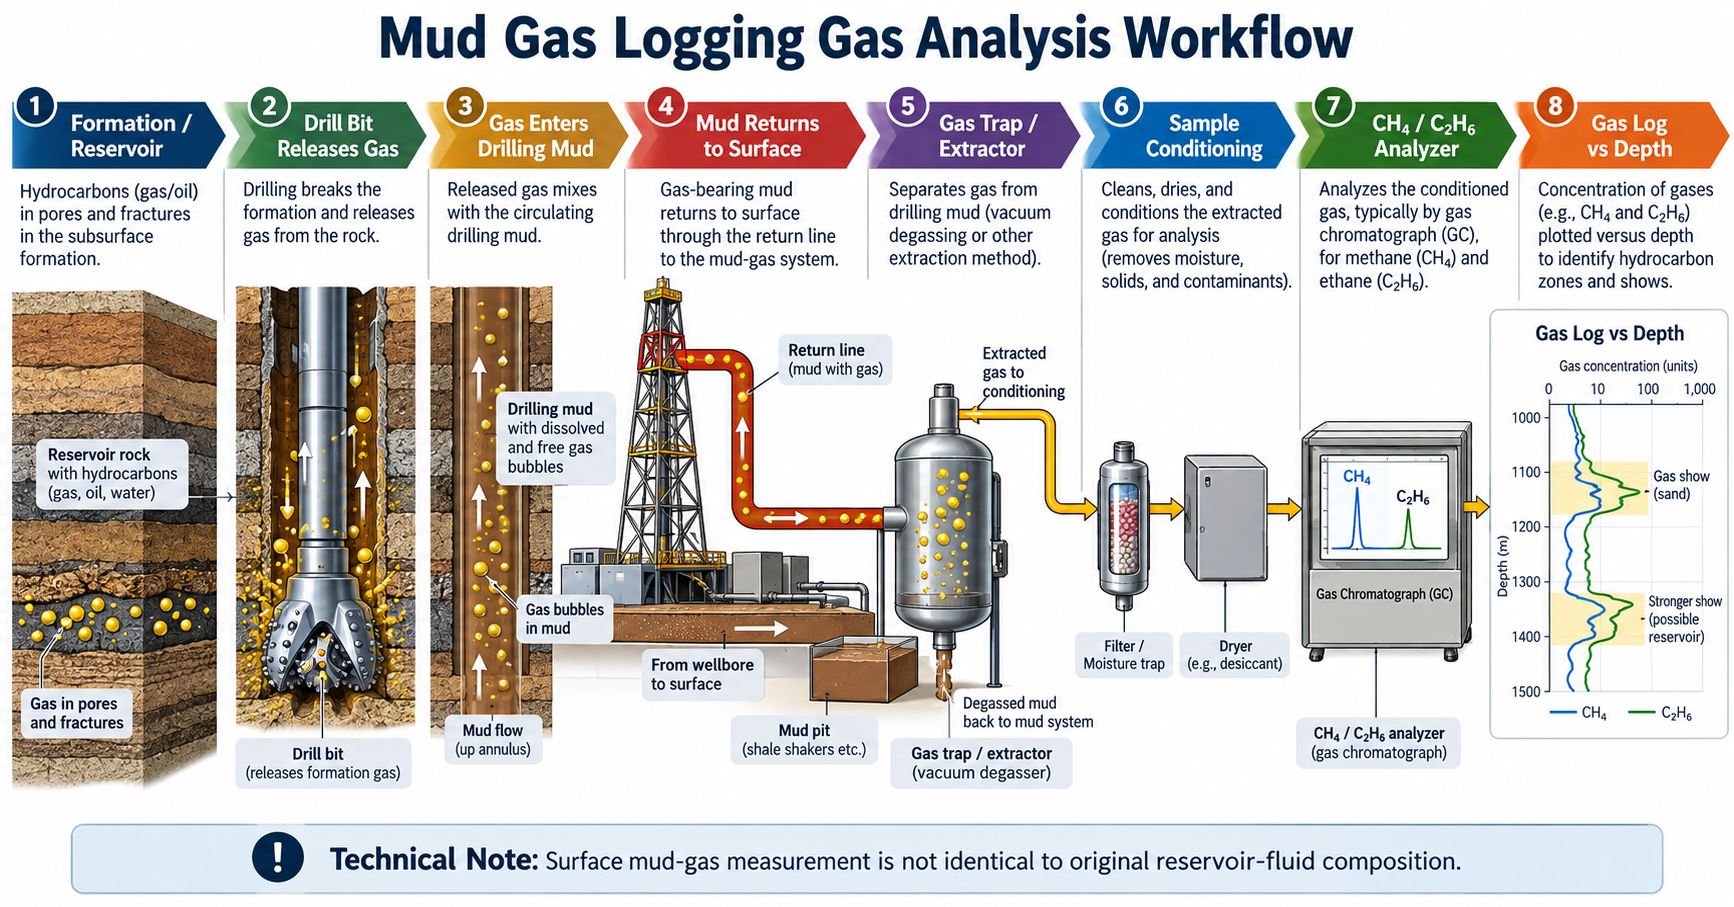
This creates a continuous or near-continuous record that can be correlated with:
- Measured depth
- Rate of penetration
- Lithology
- Drilling parameters
- Cuttings description
- Other formation-evaluation data
Industry mud-logging workflows have long used total-gas measurements together with gas chromatography to identify individual hydrocarbon components such as C1, C2, C3, C4 and C5. For background on the conventional process, see SLB’s overview of mud logging.
Mud Gas Is a Surface Measurement
The analyzer does not directly measure untouched reservoir fluid in place.
The gas has already experienced:
- Release from the formation
- Entry into drilling fluid
- Transport through the annulus
- Pressure and temperature changes
- Degassing at the surface
- Sample-line transport
- Sample conditioning
This distinction matters when interpreting concentration and component ratios.
A mud-gas log can provide highly useful depth-dependent information, but it should not be treated as a direct one-to-one measurement of original reservoir-fluid composition.
Why Measure Methane and Ethane Together?
Methane alone is useful for identifying gas shows, but adding ethane provides another compositional dimension.
Methane — C1
Methane is commonly the dominant hydrocarbon gas encountered in mud-gas measurements.
A rise in methane concentration can indicate a hydrocarbon-bearing interval, but methane can occur in several geological and biological contexts.
Ethane — C2
Ethane is a heavier hydrocarbon associated with thermogenic hydrocarbon systems and natural-gas compositions.
Its presence relative to methane can provide additional information about how hydrocarbon composition changes with depth.
C1 and C2 Together
When both are measured, engineers can examine:
- CH₄ concentration
- C₂H₆ concentration
- C1/C2 trend
- C₂H₆/CH₄ trend
- Changes between formation intervals
- Changes associated with lithology
- Changes across hydrocarbon shows
Published mud-gas work has used methane-to-ethane and related light-hydrocarbon ratios as part of fluid and source interpretation, but the usefulness and threshold values depend on the field, mud system, sampling process and geological context.
So the correct statement is:
CH₄ and C₂H₆ ratios can support fluid typing and hydrocarbon interpretation; they are not universal standalone classifiers.
How Methane and Ethane Support Mud Gas Interpretation
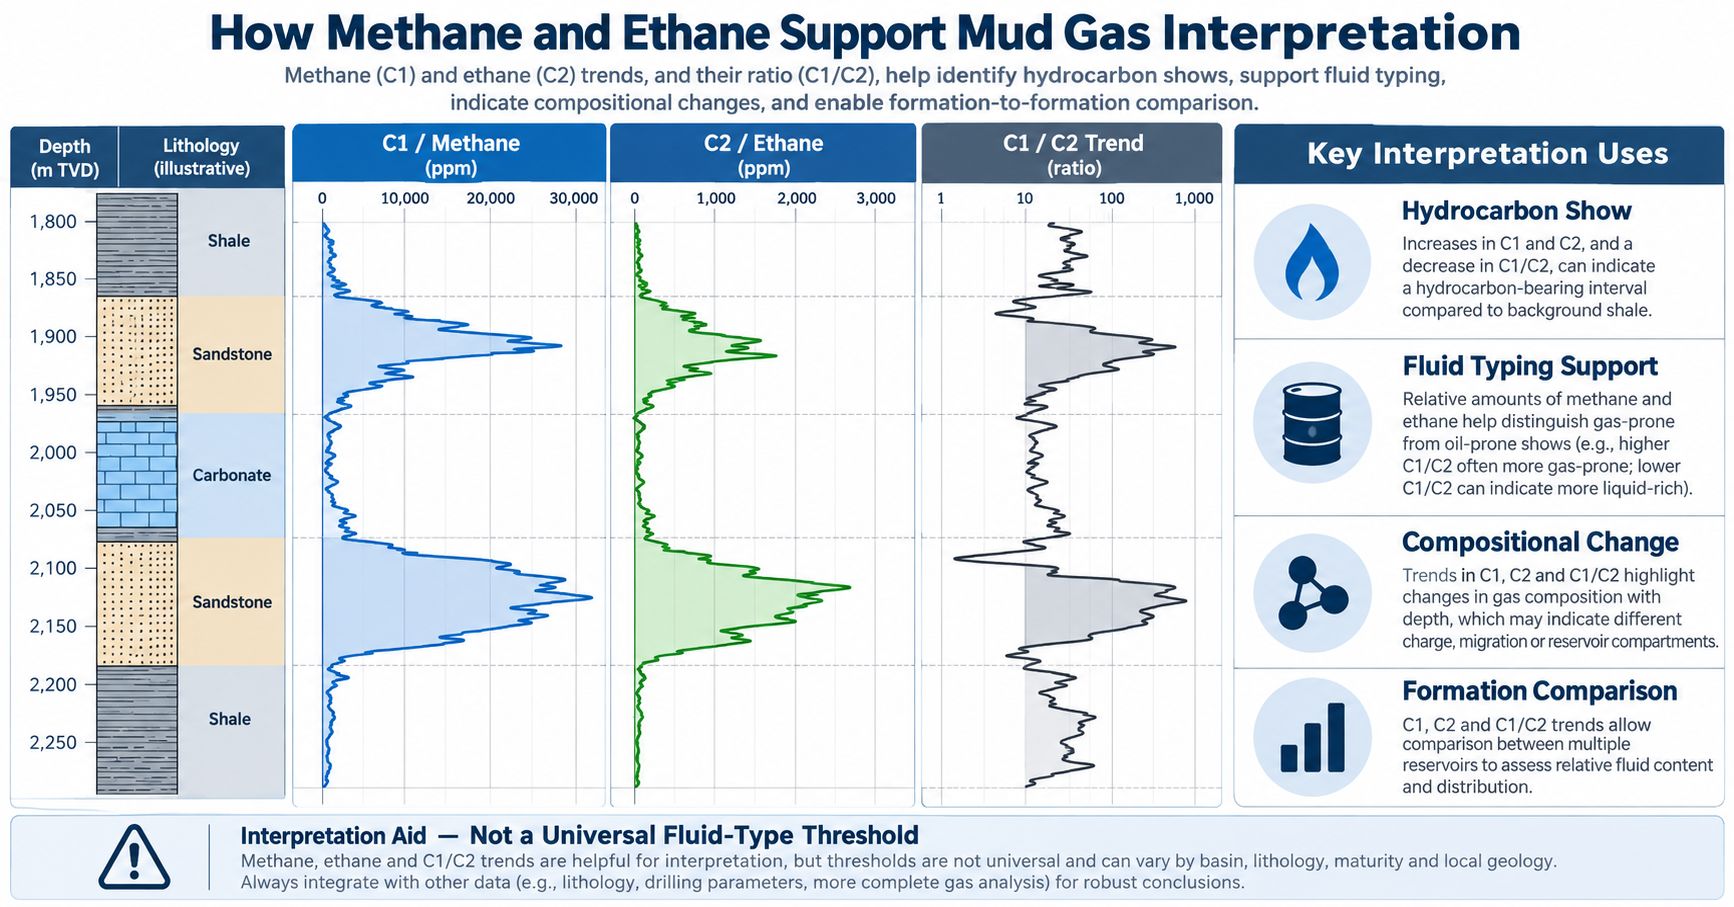
A depth-based gas log can show changes in methane and ethane that coincide with formation boundaries or hydrocarbon-bearing intervals.
Potential interpretation uses include:
Hydrocarbon Show Identification
A significant increase in C1 and/or C2 relative to background can help identify a gas show.
The result is stronger when interpreted together with:
- Lithology
- Rate of penetration
- Cuttings
- Other gas components
- Wireline or LWD data
Fluid Typing Support
Relative amounts of methane and heavier hydrocarbons can support interpretation of gas-prone versus more liquid-rich hydrocarbon systems.
But a fixed C1/C2 threshold should not be copied from one field to another without validation.
A field-specific study may derive a useful threshold from reservoir samples and mud-gas data, but that threshold is not automatically transferable to another basin.
Compositional Change with Depth
Changes in C1 and C2 trends can help identify changes in:
- Charge
- Fluid composition
- Reservoir compartment
- Hydrocarbon maturity
- Formation characteristics
Formation-to-Formation Comparison
A consistent mud-gas acquisition system can provide relative compositional trends between intervals drilled under comparable conditions.
The most defensible interpretation is therefore trend-based and context-aware, not based on one universal number.
Why Use Laser Spectroscopy for Mud Gas Analysis?
Mud logging already has established analytical tools.
A conventional mud-logging gas system may use:
- Total hydrocarbon detector
- FID
- Gas chromatograph
- Mass spectrometry in advanced systems
So why add laser spectroscopy?
The main value is targeted optical measurement.
Fast Target-Gas Measurement
A laser can repeatedly scan one selected molecular absorption region without waiting for chromatographic separation.
That can provide rapid concentration updates for gases such as:
- CH₄
- C₂H₆
Continuous Measurement Potential
A dedicated laser channel can operate continuously or at a high measurement rate, depending on:
- Scan frequency
- Signal averaging
- Gas-cell exchange rate
- Sampling system
Molecular Selectivity
TDLAS and related absorption methods measure wavelength-dependent molecular absorption.
The laser source is selected around the target gas feature.
Compact Optical Architecture
A DFB diode, detector and gas cell can be integrated into a relatively compact system.
No Chromatographic Column for the Optical Channel
The optical channel does not require chromatographic separation of the gas mixture.
However, this does not mean it automatically measures all hydrocarbon components.
A dedicated optical system may be highly selective for CH₄ and C₂H₆ while a GC provides a broader C1–C5 composition.
Laser-based hydrocarbon sensing has also been demonstrated for field-oriented natural-gas analysis. QEPAS research, for example, has shown simultaneous methane, ethane and propane measurements for on-site hydrocarbon characterization and production monitoring. See Simultaneous Detection of Methane, Ethane, and Propane by QEPAS Sensors.
1653.7 nm DFB Laser for Methane
Methane has useful near-infrared absorption around the 1.65 µm region.
For many TDLAS systems, 1653.7 nm is a practical wavelength region because a narrow DFB laser can be tuned across a selected methane absorption feature.
Lumi currently provides a Cooled 1653.7nm DFB Laser Diode for Methane Gas Sensing.
Published Lumi specifications include:
| Parameter | Typical / Published Value |
|---|---|
| Center wavelength | 1653.7 nm typ. |
| Output power | 6 mW typ. |
| SMSR | 35 dB typ. |
| Temperature coefficient | 0.1 nm/°C typ. |
| Current coefficient | 0.02 nm/mA typ. |
| Package | 6-pin TO |
| Thermal control | Integrated TEC |
The important point is not simply the number 1653.7 nm.
For TDLAS, the OEM should verify that the laser tuning range crosses the methane feature required by the detection algorithm.
For a broader wavelength-selection discussion, see 1650nm vs 1653nm Methane Laser Diode: A Wavelength Selection Guide.
~1684 nm DFB Laser for Ethane
Ethane has useful near-infrared absorption in the 1.68 µm region.
A DFB source around 1684 nm can be tuned across a selected C₂H₆ absorption feature.
But “1684 nm” is best treated as a nominal spectral region rather than one universal fixed ethane line.
Published work has used strong ethane absorption structure near approximately:
5937.2–5937.3 cm⁻¹
or around:
1684.3 nm
Methane also has nearby spectral structure, so an ethane channel must be designed with cross-interference in mind.
The laser requirement should therefore define:
- Selected C₂H₆ absorption feature
- Tuning span
- Current tuning
- Temperature tuning
- Gas pressure
- Methane concentration range
- Spectral-fitting or WMS method
For the detailed wavelength discussion, see 1684 nm Ethane DFB Laser Diode for TDLAS: Why This Wavelength?.
Dual DFB Architecture: 1653.7 nm CH₄ + ~1684 nm C₂H₆
A two-channel near-infrared system separates the methane and ethane measurements into dedicated optical channels.
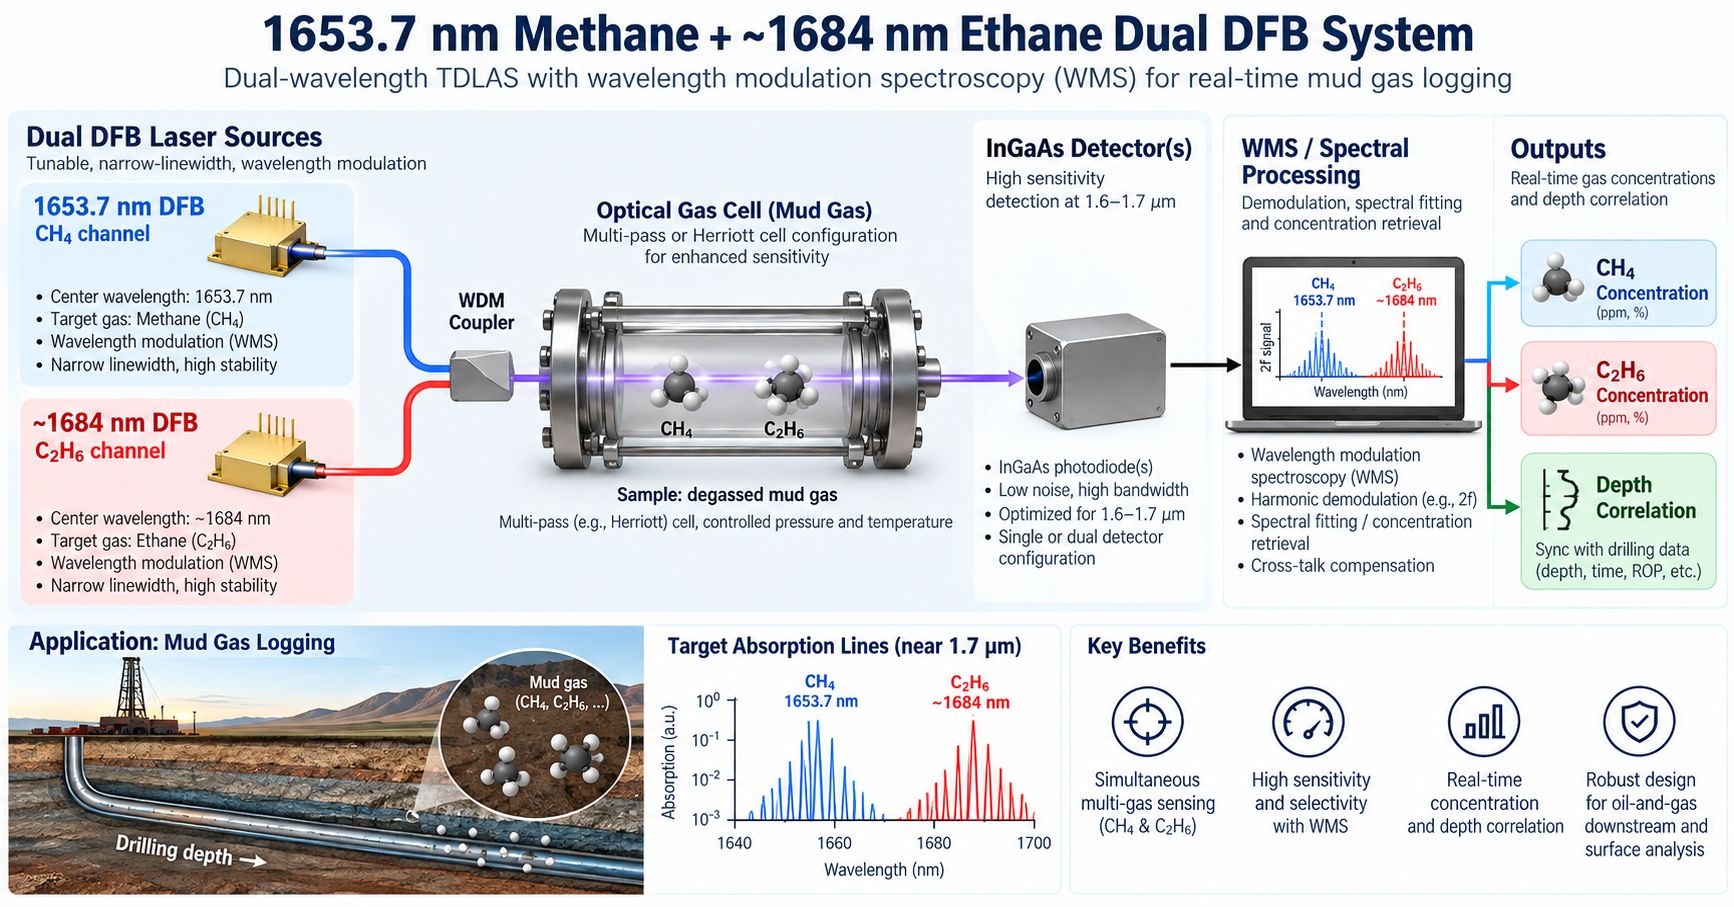
A conceptual architecture is:
1653.7 nm DFB → Methane Channel
~1684 nm DFB → Ethane Channel
followed by:
Gas Cell → InGaAs Detector(s) → WMS / Spectral Processing → CH₄ + C₂H₆ Concentrations → Depth Correlation
Two Independent Wavelength Channels
Using separate wavelengths allows each DFB to be optimized around its target absorption region.
Each channel can have its own:
- Drive current
- TEC setting
- Scan waveform
- Modulation depth
- Calibration
- Gas-concentration range
Shared or Separate Optical Path
The two wavelengths can potentially be:
- Combined into one gas cell
- Routed through separate cells
- Combined with fiber components
- Detected by one compatible detector architecture or separate detectors
The final optical design depends on:
- Cross-talk
- required response time
- optical power
- detector configuration
- WMS electronics
Depth Correlation
The concentration signals become useful for mud logging when synchronized with:
- Gas transport lag
- Drilling depth
- Rate of penetration
- Surface time
- Mud flow
The analyzer therefore needs both spectroscopy and reliable data integration.
How the Laser Analyzer Fits into a Mud Logging System
The optical analyzer sits downstream of the mud-gas extraction and conditioning stages.
A complete system may follow this sequence:
Wellbore
↓
Returning Drilling Mud
↓
Gas Trap / Extractor
↓
Sample Transport
↓
Moisture / Flow / Pressure Conditioning
↓
CH₄ + C₂H₆ Laser Analyzer
↓
Concentration vs Time
↓
Lag Correction
↓
Gas Log vs Depth
This is important because the laser should analyze a gas sample that is:
- Representative
- Flow controlled
- Free of damaging liquid carryover
- Within the intended pressure range
- Within the expected humidity range
The quality of the sampling system can be as important as the optical precision of the laser source.
Mud Gas Sampling Conditions Can Change the Result
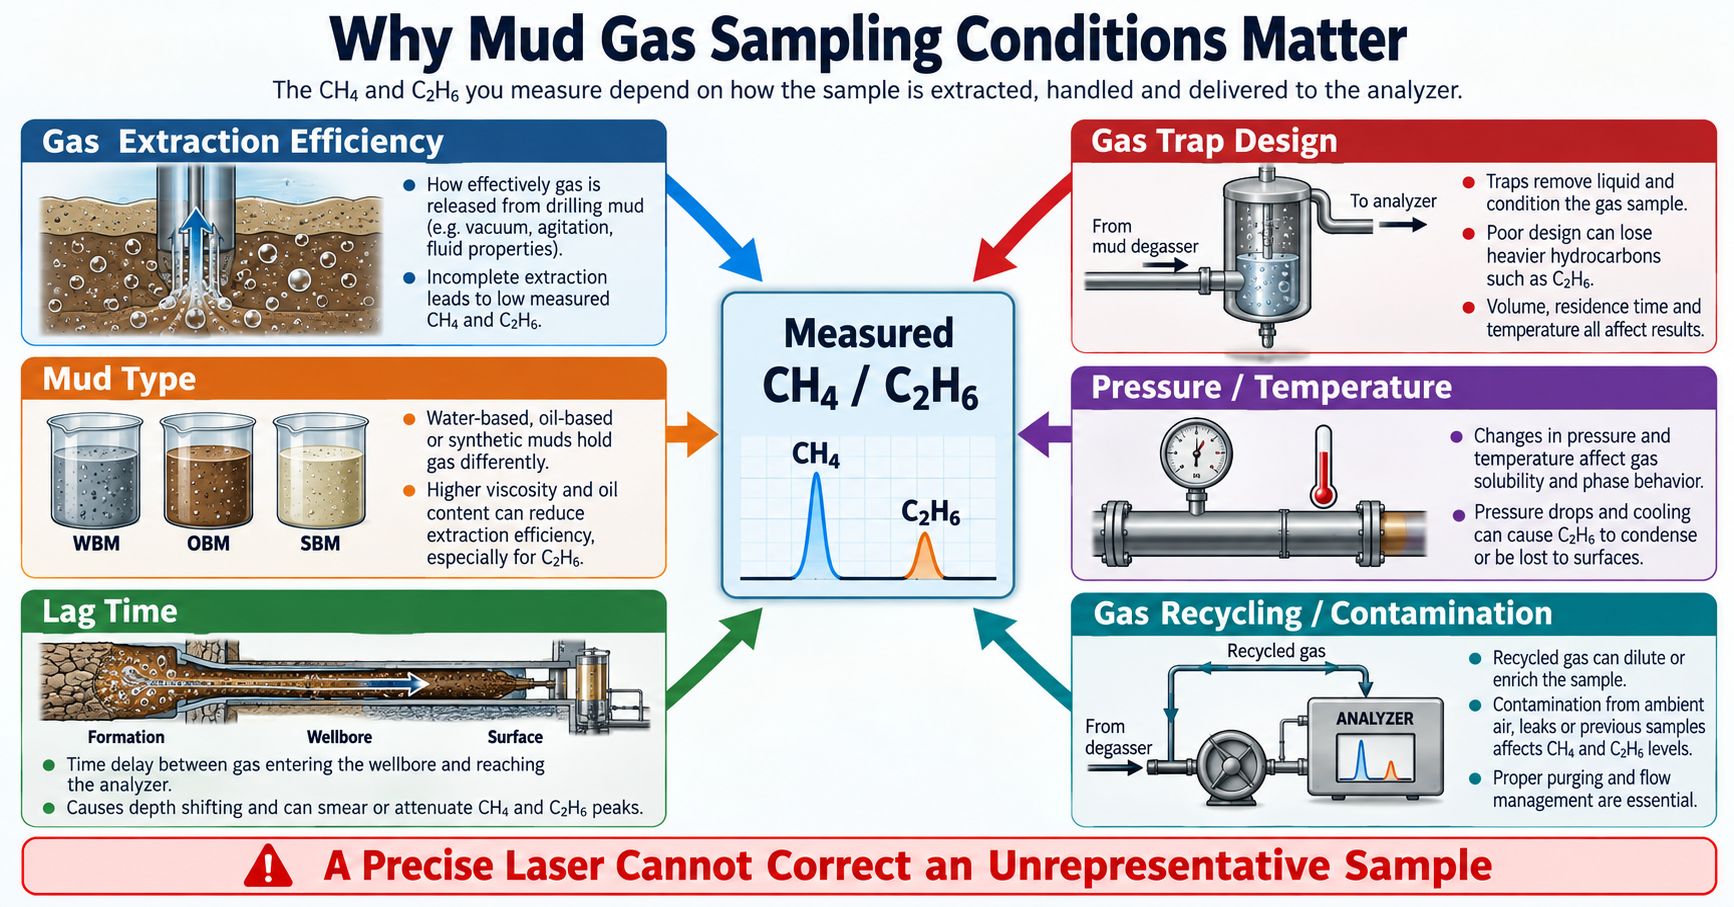
Mud-gas composition measured at the analyzer depends on how the sample is extracted and transported.
Gas Extraction Efficiency
The gas trap must release dissolved and free gas from the mud.
Extraction efficiency can depend on:
- Agitation
- Vacuum
- Mud properties
- Gas solubility
- Flow rate
- Gas-trap design
If extraction is incomplete, measured gas concentration may underrepresent the gas carried by the drilling fluid.
Mud Type
Water-based mud, oil-based mud and synthetic-based mud can retain and release hydrocarbons differently.
This matters especially when comparing gases with different:
- Solubility
- volatility
- partition behavior
An interpretation calibrated for one mud system should not automatically be transferred to another.
Lag Time
Gas released downhole takes time to reach surface.
This lag depends on:
- Well depth
- Mud circulation rate
- Annular volume
- Drilling conditions
The measured gas peak must therefore be shifted to the correct formation depth.
Gas Trap Design
Gas-trap geometry affects:
- Extraction efficiency
- Residence time
- Mixing
- Liquid carryover
Changes in gas-trap design can change the measured concentration even if the formation gas is unchanged.
Pressure and Temperature
Pressure and temperature influence:
- Gas solubility
- condensation
- adsorption
- detector response
- spectral line shape
Laser spectroscopy itself also depends on pressure and temperature because molecular absorption lines broaden and shift.
Gas Recycling and Contamination
Measured gas may be affected by:
- Recycled drilling gas
- Ambient air
- leaks
- previous samples
- connection gas
- trip gas
This is why:
A precise laser cannot correct an unrepresentative sample.
Real-time scientific mud-gas studies have shown that different extraction and analytical systems can report different absolute hydrocarbon concentrations while still preserving useful downhole trends. See Real-time drilling mud gas monitoring in the Nankai Trough.
Water Vapor, CO₂ and Other Interferences
A real mud-gas sample is more complicated than a binary CH₄/C₂H₆ mixture.
Potential sample components include:
- H₂O
- CO₂
- H₂S
- C₃H₈
- C₄+
- N₂
- O₂
- air dilution
These can affect the analyzer in several ways.
Spectral Interference
Other molecules may have absorption near a target laser scan.
The system designer should validate the full expected gas matrix.
Water and Condensation
Water vapor and liquid carryover can cause:
- optical-window contamination
- condensation
- unstable sample conditions
Sample drying or temperature control may therefore be necessary.
Corrosive or Reactive Gases
H₂S and other compounds may influence:
- gas-cell materials
- seals
- tubing
- detector housing
The optical wavelength alone does not solve material compatibility.
DAS vs WMS for Mud Gas Measurements
A laser gas analyzer can use several spectroscopy methods.
Direct Absorption Spectroscopy
DAS scans the laser through the absorption feature and measures the transmitted intensity.
It provides a straightforward absorption spectrum and can be useful for:
- calibration
- spectral verification
- relatively strong absorption signals
Wavelength Modulation Spectroscopy
WMS superimposes a higher-frequency modulation onto the wavelength scan and demodulates the detector signal, commonly at 2f.
Potential benefits include:
- Better extraction of weak absorption
- Reduced sensitivity to some low-frequency baseline drift
- Fast repeated measurement
For mud logging, the instrument designer must balance:
- Measurement speed
- Averaging
- signal-to-noise ratio
- gas-cell exchange time
- data lag
The best detection limit is not always the most useful setting if the response becomes too slow to resolve depth changes.
Laser Spectroscopy vs GC-FID for Mud Gas Analysis
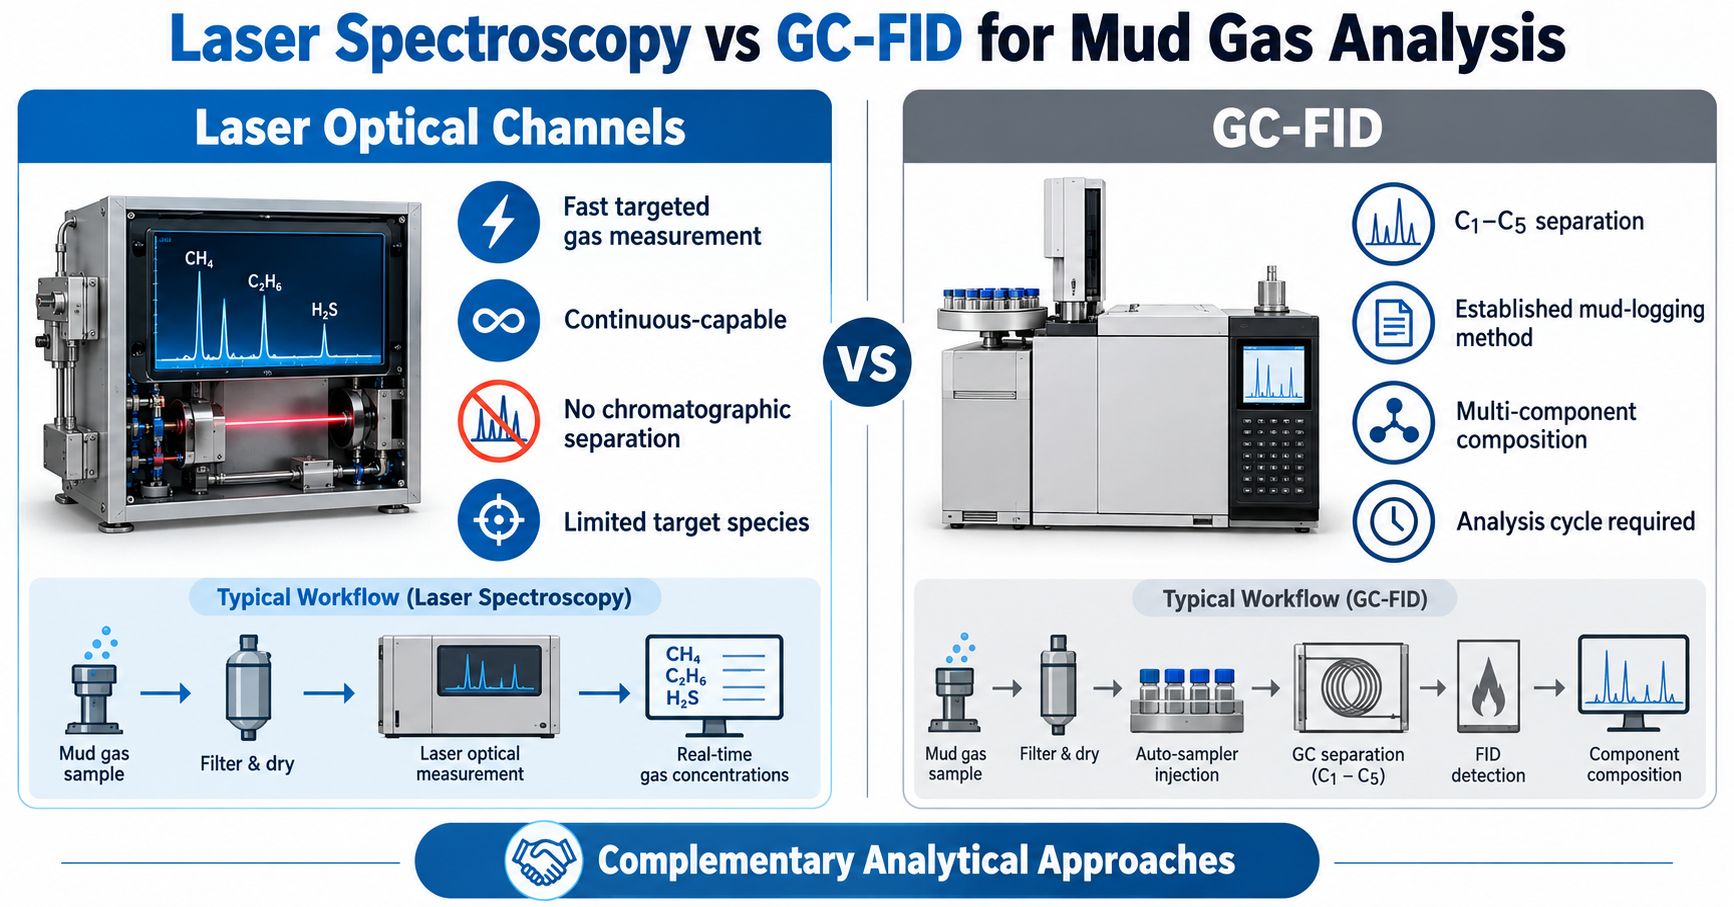
Laser spectroscopy and GC-FID solve different analytical problems.
| Factor | Dedicated Laser CH₄/C₂H₆ Channels | GC-FID |
|---|---|---|
| Main measurement | Selected target gases | Multi-component light hydrocarbons |
| Typical output | CH₄ and C₂H₆ concentration | C1–C5 composition |
| Measurement style | Continuous / rapid scanning possible | Chromatographic analysis cycle |
| Selectivity | Molecular absorption spectrum | Chromatographic separation |
| Number of target gases | Limited by wavelengths / algorithms | Multiple separated hydrocarbons |
| Hardware | Lasers, optics, detector, gas cell | Column, carrier/sample handling, FID |
| Key challenge | Spectral interference and calibration | Separation, cycle time and maintenance |
| Strong role | Fast targeted monitoring | Broad hydrocarbon composition |
| Status in mud logging | Specialized / emerging optical architecture | Established conventional approach |
The correct positioning is not:
laser spectroscopy replaces gas chromatography.
A more useful statement is:
Laser spectroscopy can complement conventional mud-gas analysis by adding fast, targeted CH₄/C₂H₆ channels where continuous concentration trends are valuable.
Traditional GC remains valuable when the operator needs broad C1–C5 composition.
How CH₄ and C₂H₆ Data Can Support Formation Evaluation
Methane and ethane data can add context to the geological and drilling information collected at the wellsite.
Identify Hydrocarbon Shows
Rapid increases in light hydrocarbons can flag an interval for closer evaluation.
Observe Composition with Depth
C1 and C2 trends can reveal changes between formations.
Support Fluid Typing
Hydrocarbon ratios may help distinguish relative gas-rich or liquid-rich tendencies when calibrated for the field and acquisition system.
Compare Reservoir Intervals
Repeated compositional trends can support comparisons between zones.
Support Wellsite Decisions
Gas data can help guide decisions about:
- sampling
- testing
- additional logging
- formation evaluation
But the gas interpretation should be integrated with other evidence.
The broader mud log may also include:
- lithology
- fluorescence
- ROP
- drilling parameters
- LWD data
- cuttings
- total gas
- additional hydrocarbons
Why CH₄/C₂H₆ Alone Is Not Enough
One ratio cannot fully characterize a reservoir.
Several factors can change the measured ratio before the gas reaches the analyzer.
Differential Extraction
Methane and ethane do not necessarily leave the mud with identical efficiency.
Mud-System Effects
Different drilling fluids can retain hydrocarbons differently.
Transport and Lag
Peaks can broaden or shift during transport to the surface.
Geological Variability
The meaning of a ratio depends on:
- basin
- maturity
- source rock
- migration
- biodegradation
- reservoir conditions
Limited Component Coverage
C1/C2 does not include:
- propane
- butanes
- pentanes
- CO₂
- H₂S
- isotopes
A broader compositional system can provide additional information.
Need for Other Formation Data
Fluid interpretation may also use:
- wireline logs
- LWD
- formation pressure
- fluid samples
- cuttings
- isotope measurements
- well testing
Therefore, the appropriate wording is:
C1/C2 supports interpretation; it does not independently determine reservoir quality or oil quality.
Free-Space or Fiber-Coupled DFB Lasers?
The mud-gas analyzer can use either free-space or fiber-delivered lasers.
Free-Space
Free-space output can be attractive when:
- Laser and gas cell are close together
- The optical bench is compact
- Direct beam access is required
- The OEM controls all source alignment
Fiber-Coupled
Fiber output can simplify modular analyzers.
It allows:
- Laser source away from the gas cell
- More flexible equipment layout
- Factory-aligned source-to-fiber coupling
- Compact optical heads
Lumi’s current Fiber-Coupled Laser Diode platform includes gas-sensing DFB configurations in both butterfly and pigtailed TO formats.
Representative 1273–1653 nm gas-sensing butterfly devices integrate:
- DFB laser
- SM fiber
- TEC
- Thermistor
- Monitor photodiode
For the optical-interface selection logic, see Fiber-Coupled Laser Diode: Pigtailed vs Free-Space Guide.
TO-Can or Butterfly Package?
Both package families can support a gas-sensing DFB source.
TO-Can
A TO package can provide:
- Compact size
- Free-space output
- Fiber-pigtail option
- TEC in selected designs
- Simple mechanical integration
Lumi’s current methane product uses a compact TEC-controlled TO package at 1653.7 nm.
Butterfly
Butterfly packages offer more integration space for:
- TEC
- Thermistor
- Monitor photodiode
- Optical isolator
- SM/PM fiber
- Multiple electrical connections
This can be useful for a stable fiber-fed analyzer.
The correct choice depends on system layout rather than the gas name.
For a deeper comparison, see Butterfly vs TO-CAN Package for Gas Sensing Laser Diodes.
A Practical OEM Dual-Channel Architecture
A production mud-gas laser analyzer could contain:
Laser Section
- 1653.7 nm methane DFB
- ~1684 nm ethane DFB
- Laser current drivers
- TEC controllers
- Thermistors
Optical Section
- SM fiber or free-space routing
- Collimators
- Gas cell
- Optional WDM
- Optical isolators where required
Detector Section
- InGaAs photodiode(s)
- Transimpedance amplifier
- ADC
Signal Processing
- Laser scan generation
- 1f / 2f demodulation
- Spectral fitting
- Baseline correction
- Interference compensation
- Gas calibration
Mud-Logging Integration
- Gas-flow data
- Lag correction
- Surface time
- Bit depth
- ROP
- Mud parameters
- Alarm / event logic
This illustrates why a mud-gas product is not simply “two lasers plus one detector.”
The DFB sources are important components inside a larger sampling, optical and data system.
DFB Laser RFQ for Mud Gas Logging
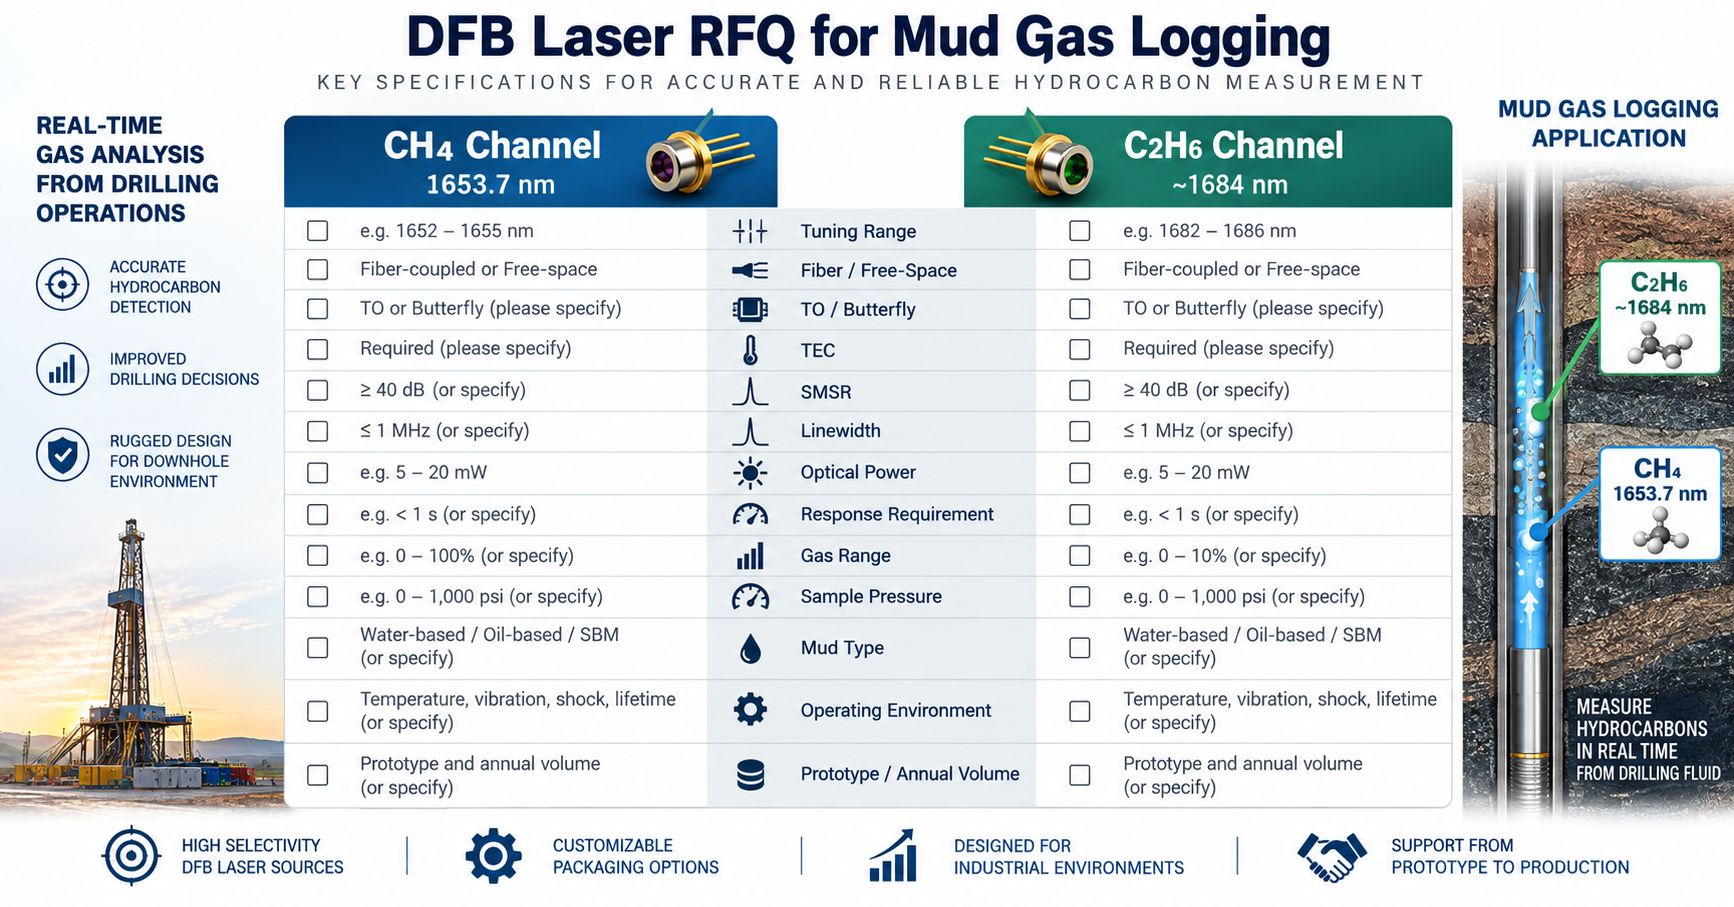
When sourcing the laser channels, an OEM should specify more than two nominal wavelengths.
| Requirement | Methane Channel | Ethane Channel |
|---|---|---|
| Target gas | CH₄ | C₂H₆ |
| Nominal wavelength region | 1653.7 nm | ~1684 nm |
| Exact absorption feature | Project-defined | Project-defined |
| Required tuning span | Based on selected CH₄ feature | Based on selected C₂H₆ feature |
| Laser architecture | DFB | DFB |
| Optical power | Specify measurement point | Specify measurement point |
| SMSR | Project requirement | Project requirement |
| Linewidth | Project requirement | Project requirement |
| Current tuning | Required scan / modulation | Required scan / modulation |
| Temperature tuning | Required | Required |
| Package | TO / Butterfly | TO / Butterfly |
| Optical output | Free-space / SM fiber | Free-space / SM fiber |
| Connector | Project-defined | Project-defined |
| TEC | As required | As required |
| Thermistor | As required | As required |
| Detection method | DAS / WMS | DAS / WMS |
| Main interferents | H₂O / nearby gases | CH₄ / nearby hydrocarbons |
| Gas concentration range | OEM-defined | OEM-defined |
The OEM should also provide system-level context:
- Mud type
- Sample pressure
- Sample temperature
- Expected humidity
- Required response time
- Operating environment
- Prototype quantity
- Annual volume
This allows the laser source to be evaluated against the real analyzer rather than only a wavelength label.
Common Design Mistakes
Mistake 1: Assuming CH₄/C₂H₆ Directly Determines Oil Quality
It does not.
The ratio may support hydrocarbon interpretation but should be integrated with other geological and analytical data.
Mistake 2: Ignoring the Gas Extraction System
The analyzer can only measure the sample it receives.
Poor extraction can dominate the measurement error.
Mistake 3: Treating 1684 nm as One Universal Ethane Line
The actual ethane channel needs a validated tuning range around the selected spectral feature.
Mistake 4: Selecting Lasers Before Defining the Concentration Range
A mud-gas system may encounter very different concentration ranges from trace sensing applications.
Gas dilution, path length and optical power must match the intended range.
Mistake 5: Assuming Laser Spectroscopy Measures C1–C5 Like GC
A two-laser CH₄/C₂H₆ system measures two target species.
It does not automatically provide propane, butane and pentane composition.
Mistake 6: Ignoring Pressure and Temperature
Spectral line shape and gas density depend on measurement conditions.
Mistake 7: Promising a Detection Limit from Laser Power Alone
Detection limit is a complete-system specification involving:
- absorption
- path length
- detector
- electronics
- sampling
- signal processing
- calibration
Lumi DFB Laser Options for Oil & Gas Analyzer Development
Lumi currently provides DFB laser platforms suitable for wavelength-sensitive gas-analysis development.
1653.7 nm Methane Channel
The 1653.7nm Cooled DFB Laser Diode provides a published methane-oriented TO package with integrated TEC.
Fiber-Coupled Gas-Sensing DFB Platform
The 1273–1653nm DFB Pigtailed Butterfly Laser Diode demonstrates Lumi’s current fiber-delivered TDLAS platform with:
- SM fiber
- TEC
- Thermistor
- Monitor photodiode
- Gas-sensing wavelength configurations
Compact Fiber-Pigtailed TO
Lumi also provides Cooled TO-CAN Laser Diodes with Fiber Pigtails for Gas Detection.
~1684 nm Ethane Project
For the ethane channel, wavelength selection should be evaluated against the customer’s actual target absorption feature and required tuning span.
The project should therefore define:
- C₂H₆ spectral target
- tuning window
- optical power
- package
- fiber interface
- thermal control
- expected volume
rather than assuming that any nominal “1684 nm” source will automatically match the analyzer.
Explore the broader Lumi DFB Laser Diode platform for TO, butterfly and fiber-coupled options.
Frequently Asked Questions
Why measure methane and ethane during mud gas logging?
Methane identifies the dominant light-hydrocarbon signal, while ethane adds compositional information. Their concentrations and trends can support hydrocarbon-show interpretation, fluid typing and formation comparison.
What wavelengths can be used for methane and ethane DFB channels?
A common near-infrared approach uses approximately 1653.7 nm for methane and approximately 1684 nm for ethane. The exact target wavelength and tuning span must match the selected molecular absorption features.
Does C1/C2 tell you whether the reservoir contains oil or gas?
It can support fluid typing in an appropriately calibrated field workflow, but there is no universal C1/C2 threshold that applies to every basin, mud system and sampling method.
Can laser spectroscopy replace mud-logging gas chromatography?
Not universally. Dedicated laser channels can provide fast targeted gas measurements, while GC-FID remains valuable for broad C1–C5 hydrocarbon composition. They can be complementary.
Why use a DFB laser for mud-gas TDLAS?
DFB lasers provide narrow, wavelength-selective output and can be tuned using injection current and temperature, which is useful for scanning gas absorption features.
Can both methane and ethane lasers share one gas cell?
Potentially yes. The optical architecture can combine the wavelengths into one cell or use separate paths. The best design depends on cross-talk, detectors, power and signal-processing requirements.
Is fiber output useful for a mud gas analyzer?
Yes when the laser source and gas cell need to be separated or the analyzer uses a modular optical layout. Free-space output can also be appropriate for compact internal optical benches.
Which package is better: TO-can or butterfly?
TO-can is compact and can support free-space or pigtailed configurations. Butterfly packages provide more space for integrated TEC, monitoring and factory-aligned fiber. The best package depends on the analyzer architecture.
Does a precise laser guarantee accurate mud-gas composition?
No. Gas extraction, lag, mud type, sample conditioning, pressure, temperature and calibration can all influence the result.
What information should I send when requesting CH₄ and C₂H₆ DFB lasers?
Provide the target gases, exact absorption regions, tuning ranges, optical power, package, output interface, TEC requirement, concentration ranges, spectroscopy method, sample conditions, prototype quantity and expected annual volume.
From Mud Gas to Actionable Hydrocarbon Information
Methane and ethane optical channels can add a fast, selective measurement layer to mud-gas analysis.
A practical dual-channel concept is:
1653.7 nm DFB → CH₄
plus:
~1684 nm DFB → C₂H₆
integrated with:
Gas Extraction → Sample Conditioning → Optical Cell → InGaAs Detection → Spectral Processing → Lag-Corrected Depth Log
The laser sources are only one part of the system.
Reliable interpretation also depends on:
- Representative gas extraction
- Correct lag calculation
- Controlled pressure and temperature
- Cross-interference management
- Calibration
- Geological context
For this reason, CH₄/C₂H₆ data are most useful as part of a broader formation-evaluation workflow rather than as a standalone claim about reservoir quality.
For OEM mud-gas, wellsite or oil-and-gas analyzer projects, Lumi can evaluate methane and ethane DFB requirements based on the target absorption region, package, fiber interface, thermal-control strategy and expected production volume.
